Godox makes three models of speedlites that are similar, but each have their own unique features. This is a long post, but it should help you decide which model to buy.
Common to all models
-1- All three models can be used by themselves in the camera’s hot shoe, or in combination as either master or remote flashes in a multi-flash setup. They are all fully compatible with the Godox X3 and X3 Pro wireless radio triggers, too.
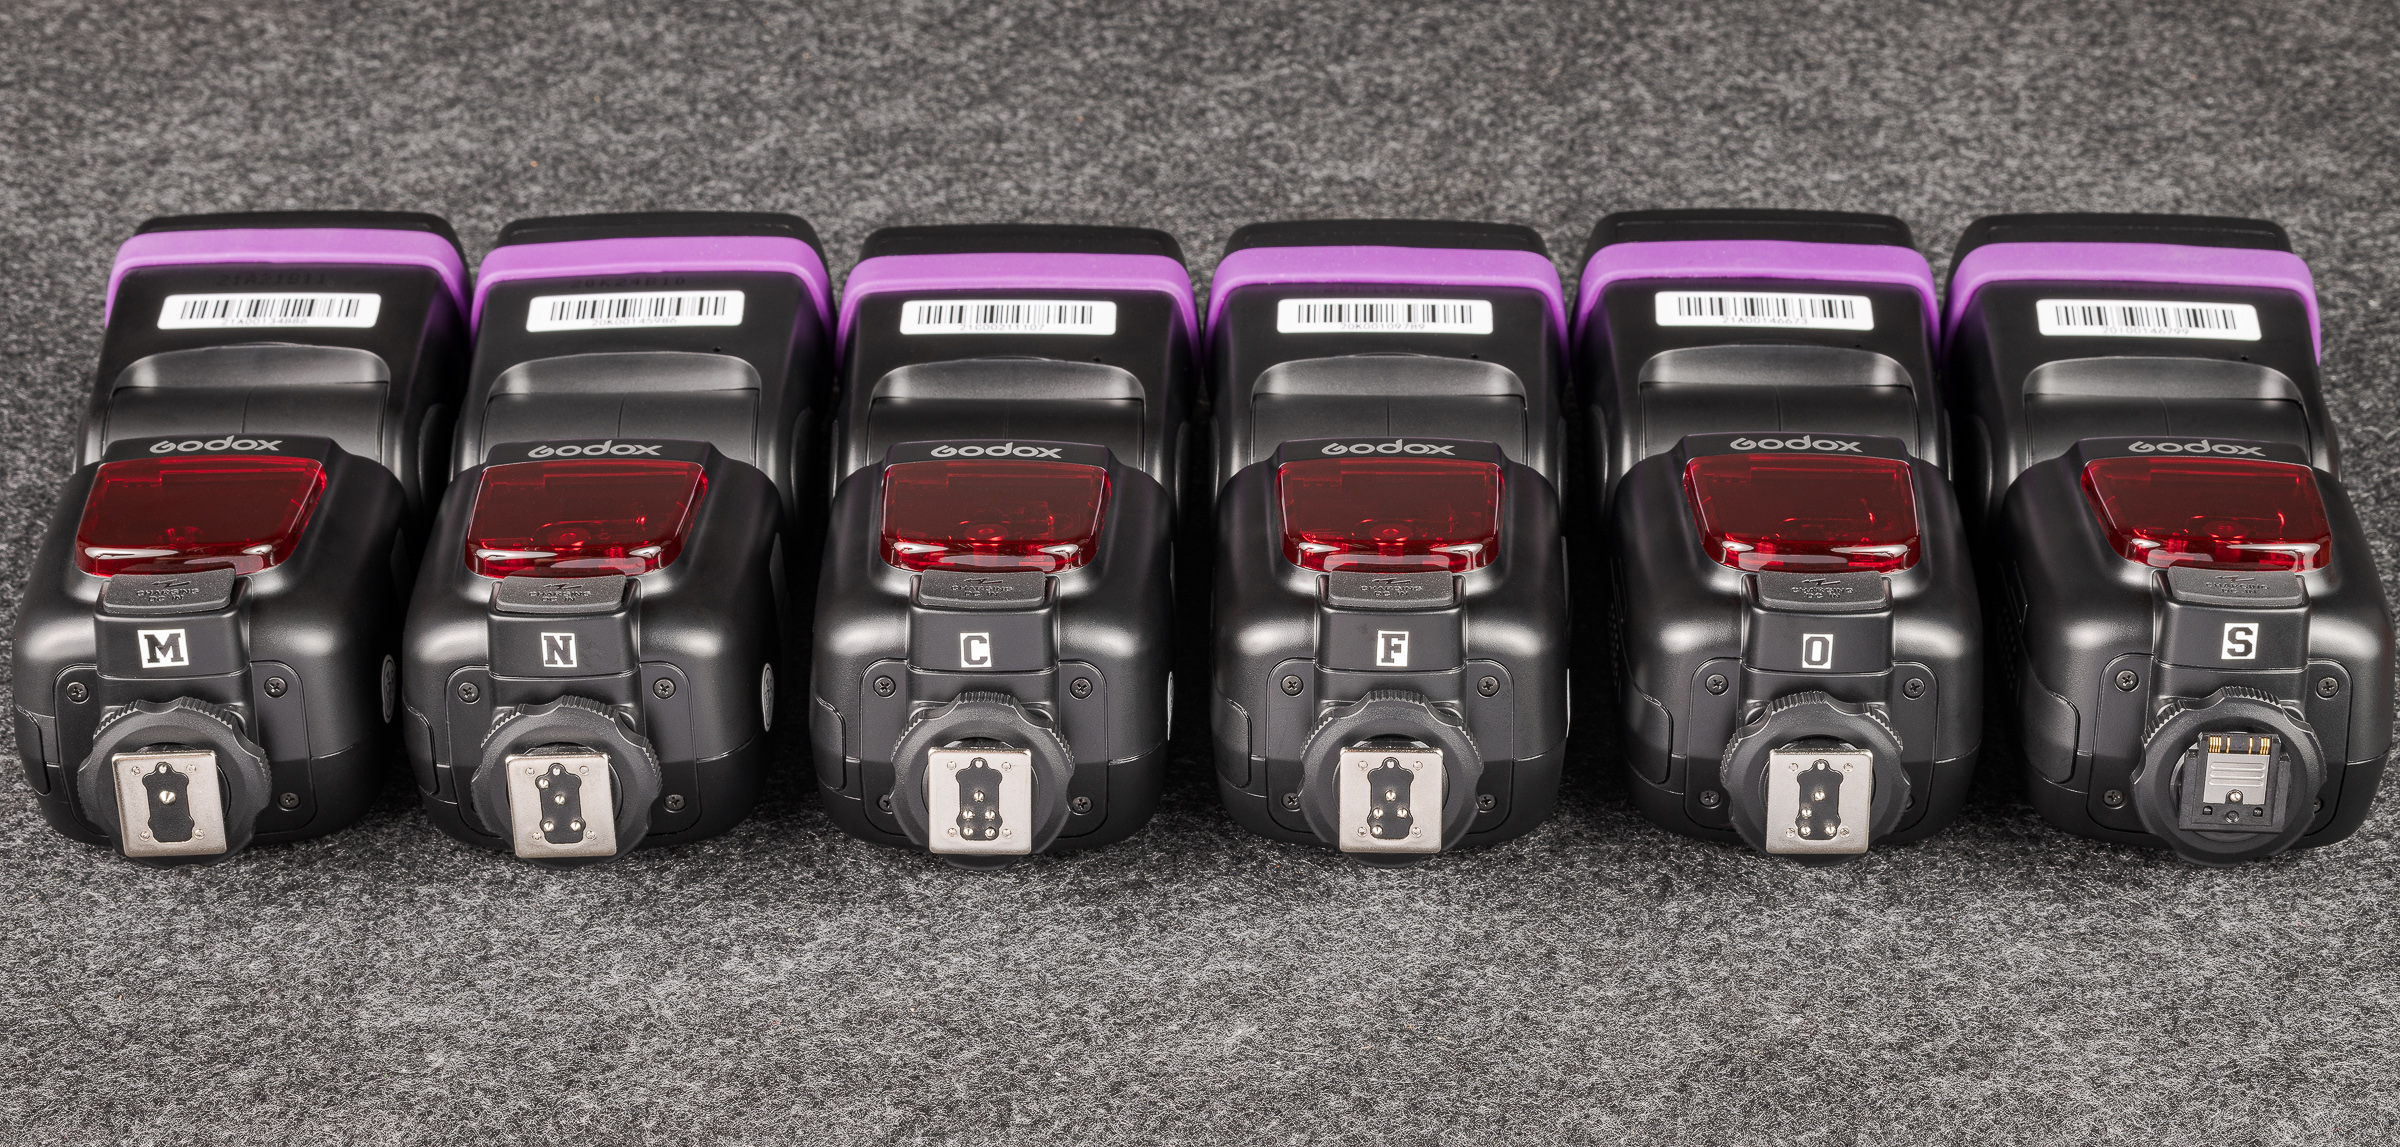
-2- Godox makes versions of each model for Nikon (N), Canon (C), Sony (S), FUJIFILM (F), and Olympus/Panasonic (O). (The M flash at the left below is the TT600 pure manual flash.) These camera-specific versions allow the same full TTL compatibility as do the camera manufacturer’s flashes. They are denoted by the first letter of the camera brand as a suffix. In other words, for a Nikon camera, you would order a TT685iiN or V860iiiN or V1N. [Click on image to enlarge, then click on left arrow to return to post.]
Godox TT685 flash hot shoes for different camera brands.
-3- All of these Godox flashes can be used in full manual mode on any camera body by any manufacturer—except for Sony. Because of its different hot shoe design, including the position of the firing pin, flashes for Sony do not work in other camera hot shoes—even in manual mode. Likewise, flashes with hot shoes for other camera brands will not work in a Sony hot shoe, even in manual mode.
-4- That being said, Godox flashes for any camera brand will work in TTL mode as remote flashes as long as the master flash or wireless trigger in the camera hot shoe matches the camera brand.
For example, on a Nikon camera, you could use a Godox TT685iiN in i-TTL mode (which is Nikon’s brand of TTL) in the camera’s hot shoe. You could then use a second TT685ii in i-TTL, regardless of the camera body brand the flash was made for. For instance, a TT685iiC (designed for e-TTL in Canon cameras) would work in Nikon’s i-TTL when used as a remote as long as a TT685iiN, V850iiiN, V1N, or wireless trigger for Nikon was in the hot shoe as the master or controller flash or trigger. That’s pretty remarkable. I highly recommend you buy all your flashes for your camera body brand, but you might be able to borrow Godox flashes for other camera brands from colleagues for additional off-camera flash setups.
-5- In Manual mode, flash power can be adjusted in tenths of a stop. In TTL mode, the flash exposure compensation can be adjusted in thirds of a stop.
-6- Both the TT685ii and the V860iii have the same specs as the top-of-the-line flashes by most of the camera manufacturers, with Guide Numbers of 197 feet (60 meters) at ISO 100. The V1 specs are given in Watt-seconds (like studio strobes) instead of Guide Numbers. My experience is that the power outputs of the three models are similar.
-7- All of these models can be used as remotes in optic mode with any other flash or studio strobe. I routinely use one or more in optic mode in conjunction with my Profoto Pro-B3 studio lights. Optic mode only works in manual flash mode.
-8- In the TTL mode of any manufacturer’s flash, the flash exposure compensation is recalculated with each shutter click. This is desirable when the flash-to-subject distance is changing. But it can lead to inconsistent exposures when the distance doesn’t change.
These flashes all have a very handy TCM button that converts the TTL flash compensation into manual flash power. This allows for the camera and flash to calculate the proper flash compensation in TTL mode, but then to switch to manual mode to ensure the flash exposure is consistent between frames when your subject remains at the same distance from the flash.
-9- All three models cost much less than half the price of a top-of-the-line flashes by most of the camera manufacturers.
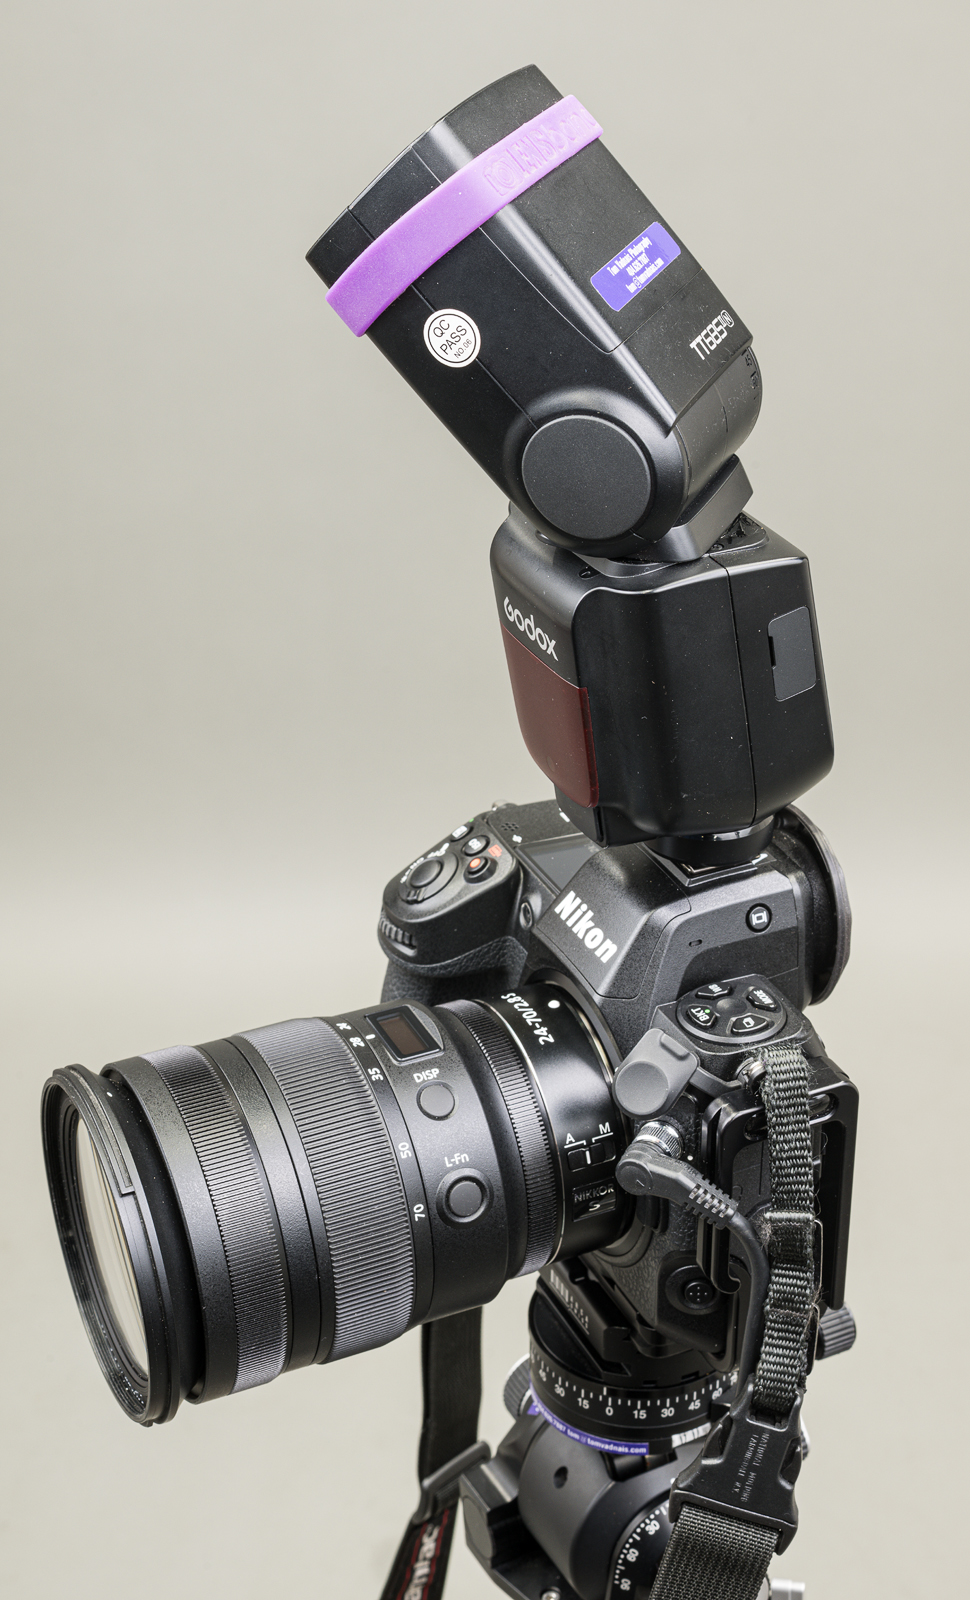
-10- The flash head of all three models can be tilted downward at -7° for close-up use and tilted backwards to 120°. All three flash heads rotate 330°.
-11- All three models come with a handy stand and a high quality case.
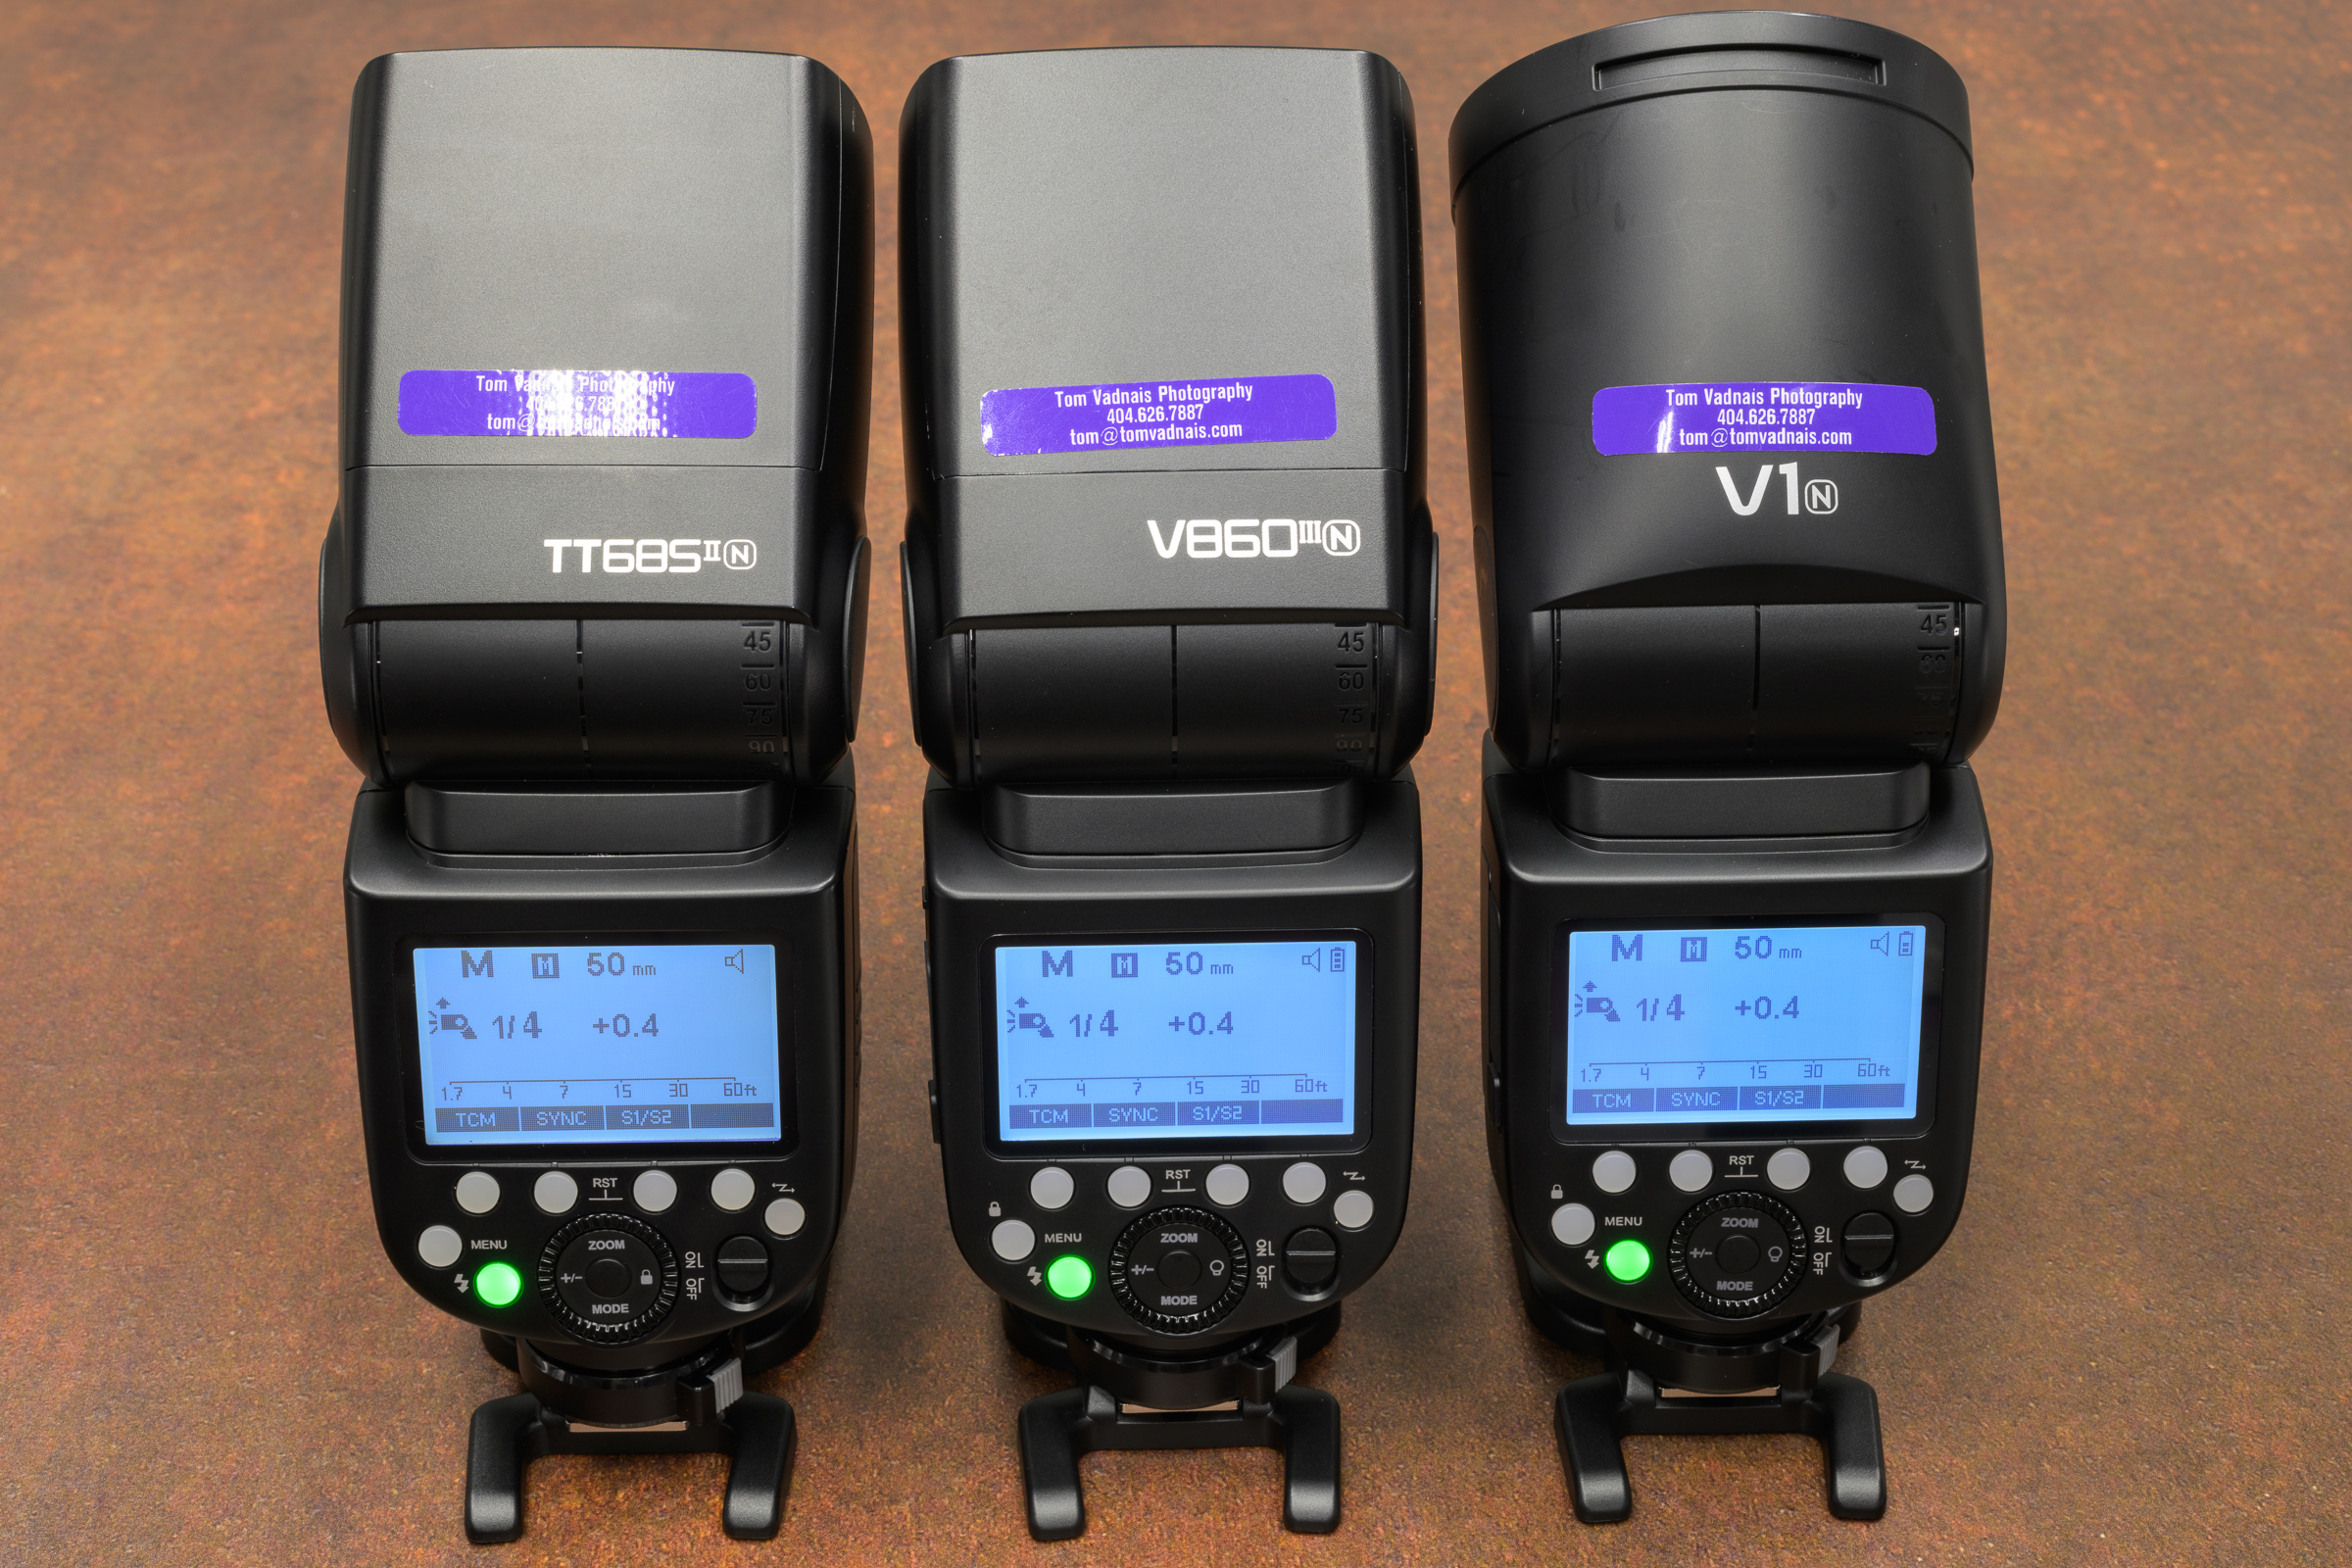
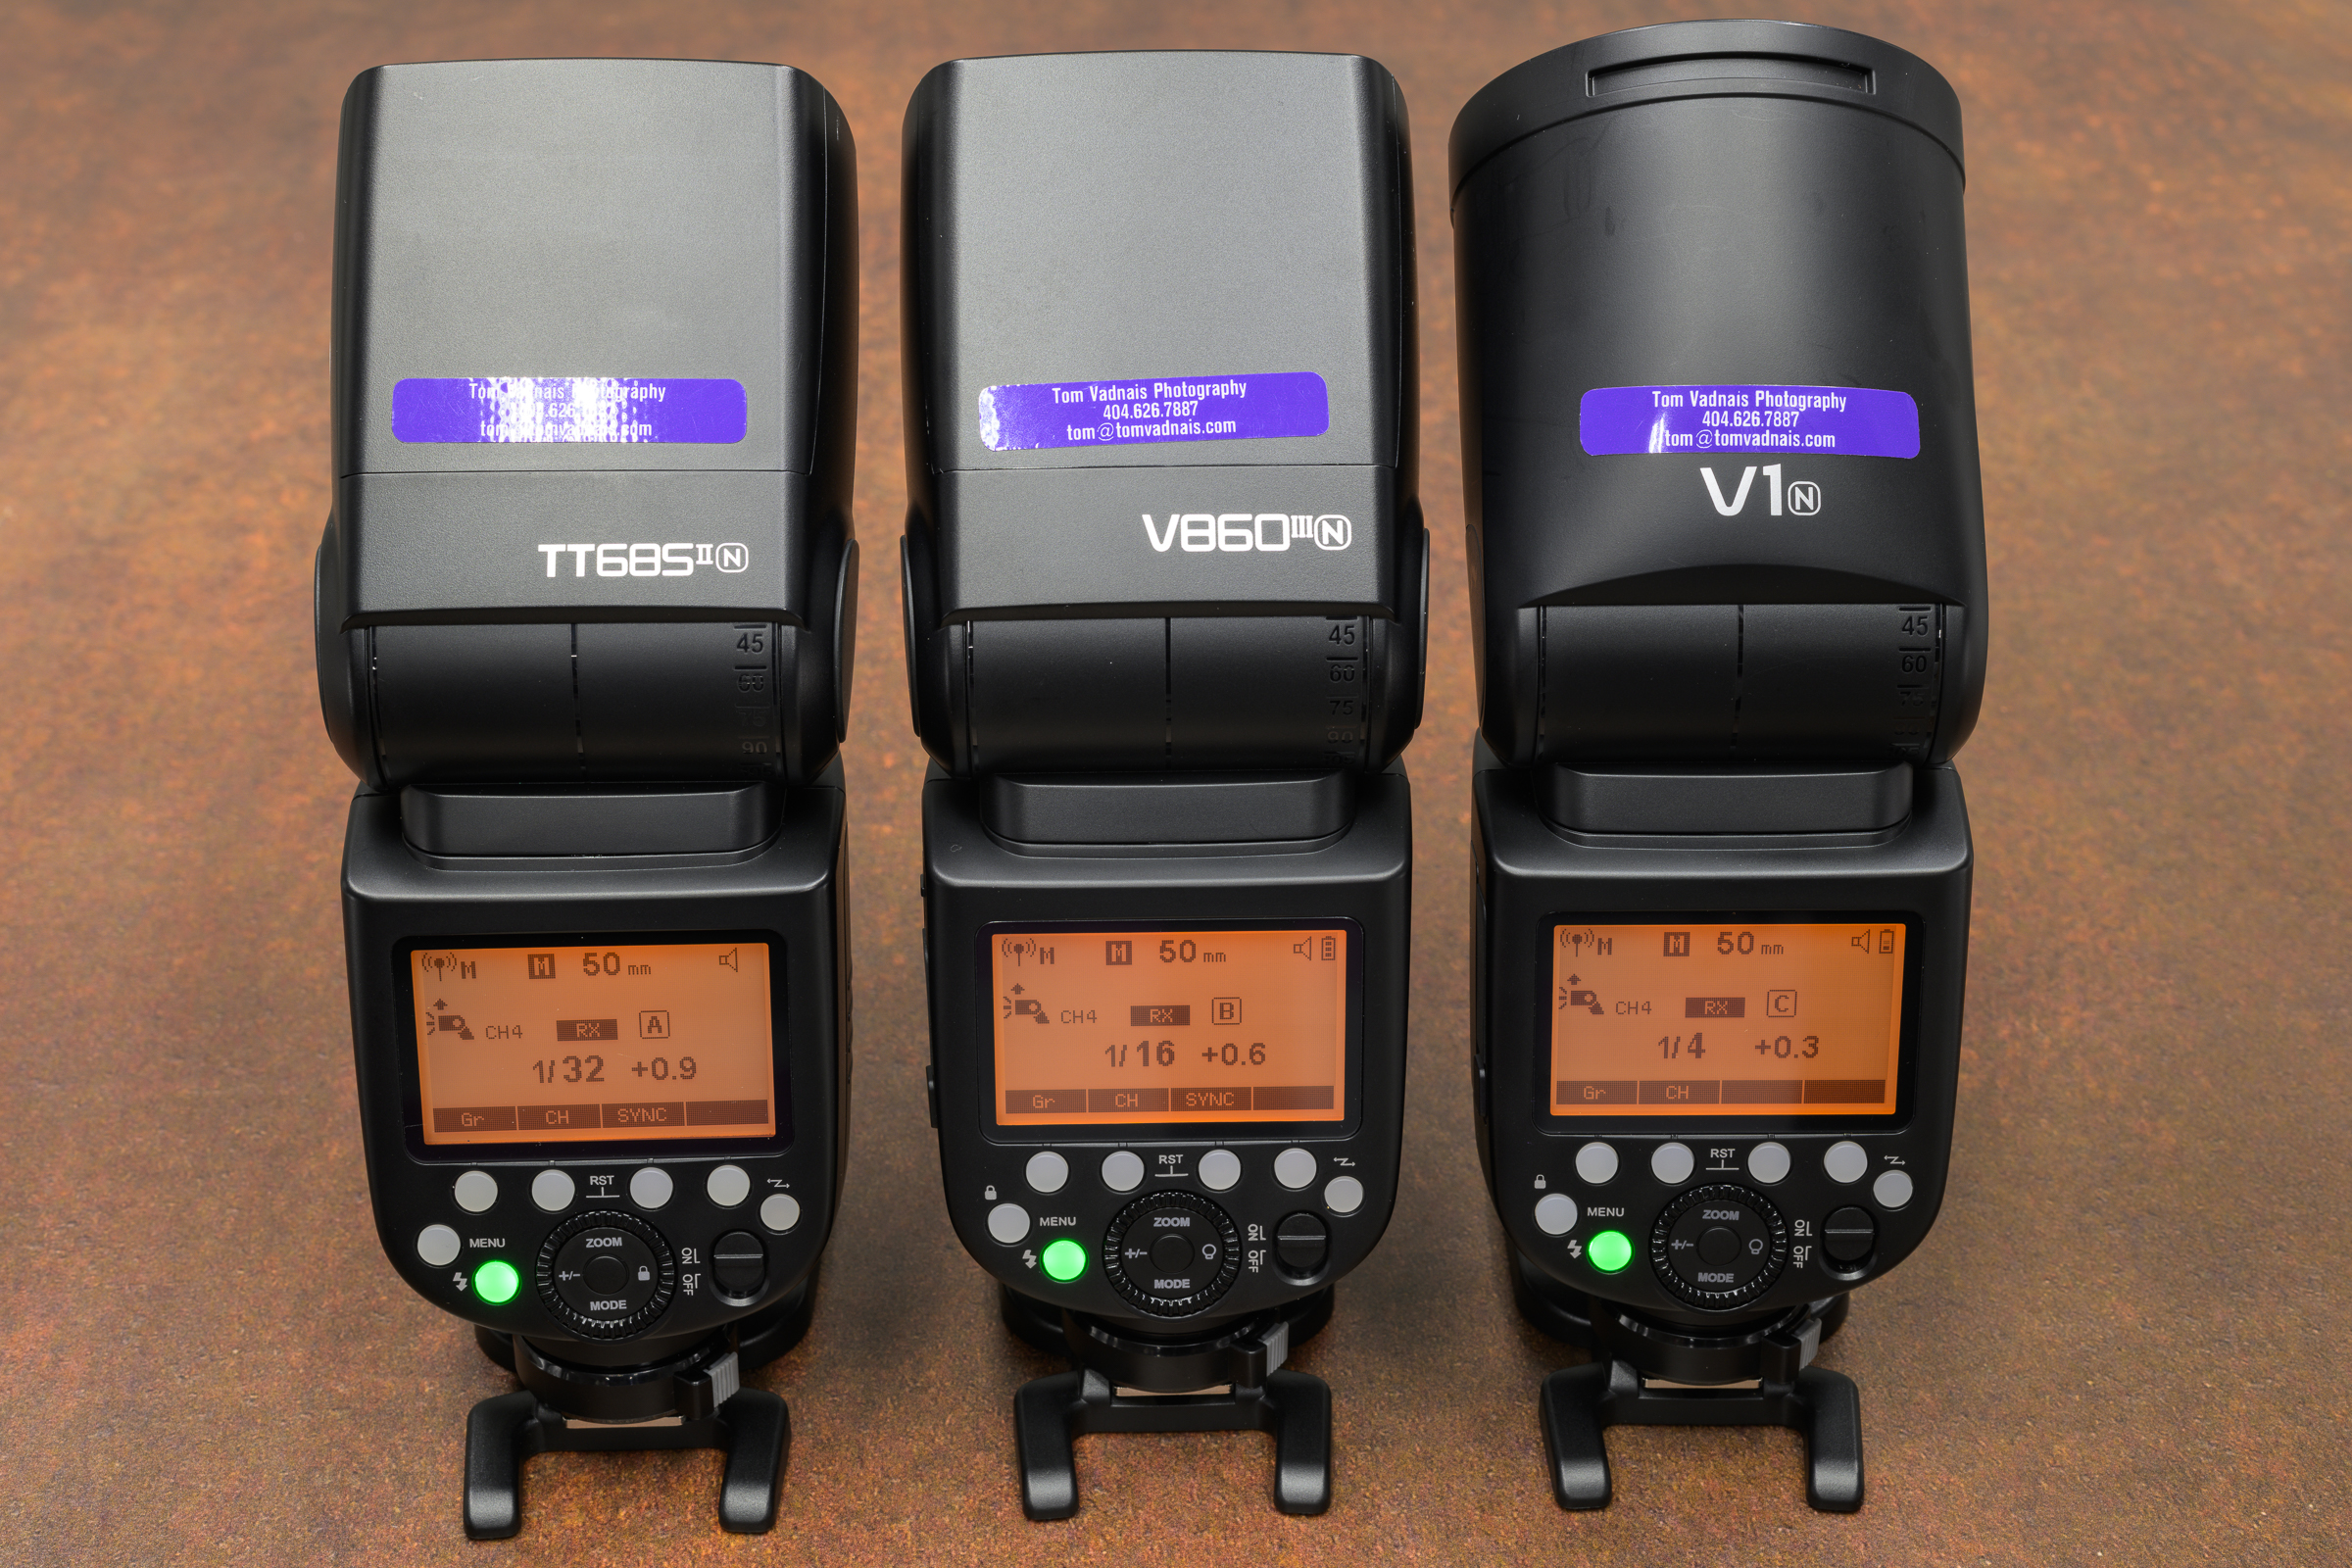
-12- All have the same intuitive interface and menu, and all are completely interchangeable in any multiple flash setup. All menus turn orange when any of the flashes is used in remote mode, which is a handy double-check. [Click on image to enlarge, then click on left arrow to return to post.]
Godox speedlite menu and interfaceGodox speedlte master menu. [Note: flash must be mounted in a camera hot shoe to function as a master flash.]Godox speedlite remote menu
Differences between models
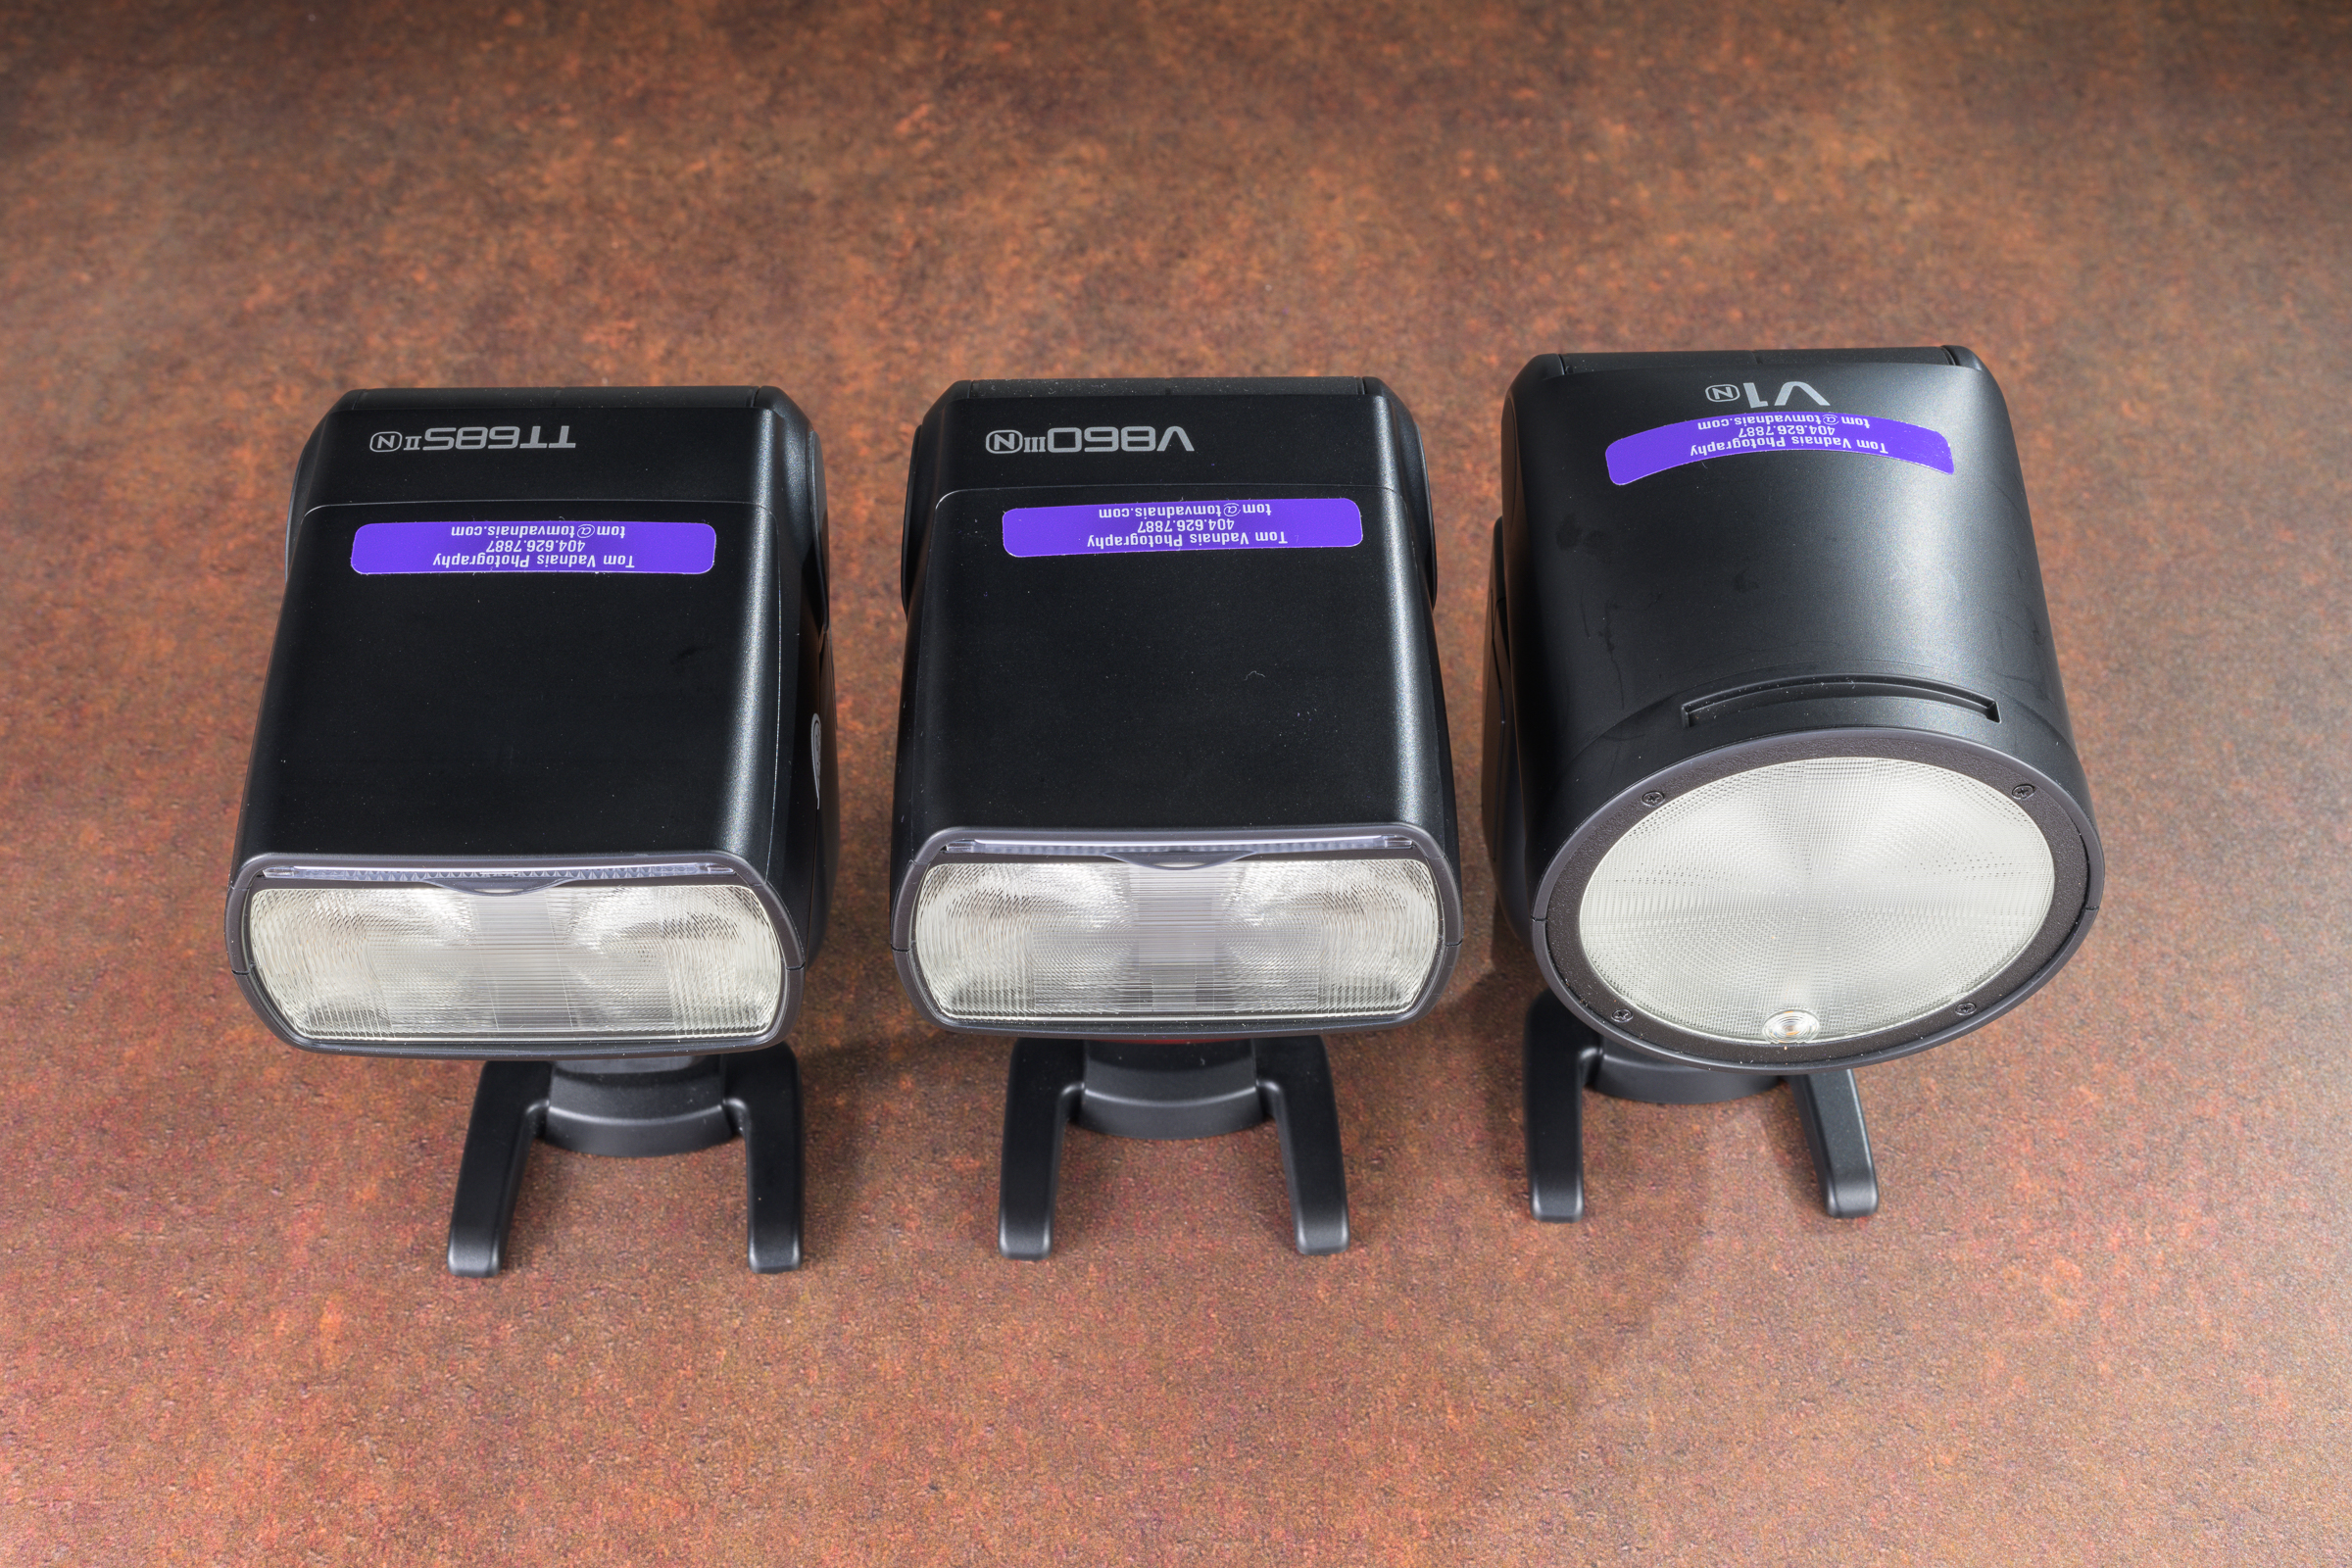
-1- The most obvious difference is that the TT685ii and the V860iii have the same rectangular head, while the V1 has a round head. The shape of the head obviously affects the shape of the light output (and perhaps the catch light in a person’s eyes), but I’ve not experienced any meaningful differences in forensic use. In fact, my studio strobes are Profoto B3 Pro lights with round heads, while my most-used speedlite is the rectangular-headed TT685ii. Depending on the amount of light needed, I not only use them interchangeably, but I often use them together for a single image. [Click on image to enlarge, then click on left arrow to return to post.]
Godox speedlite flash head shapes
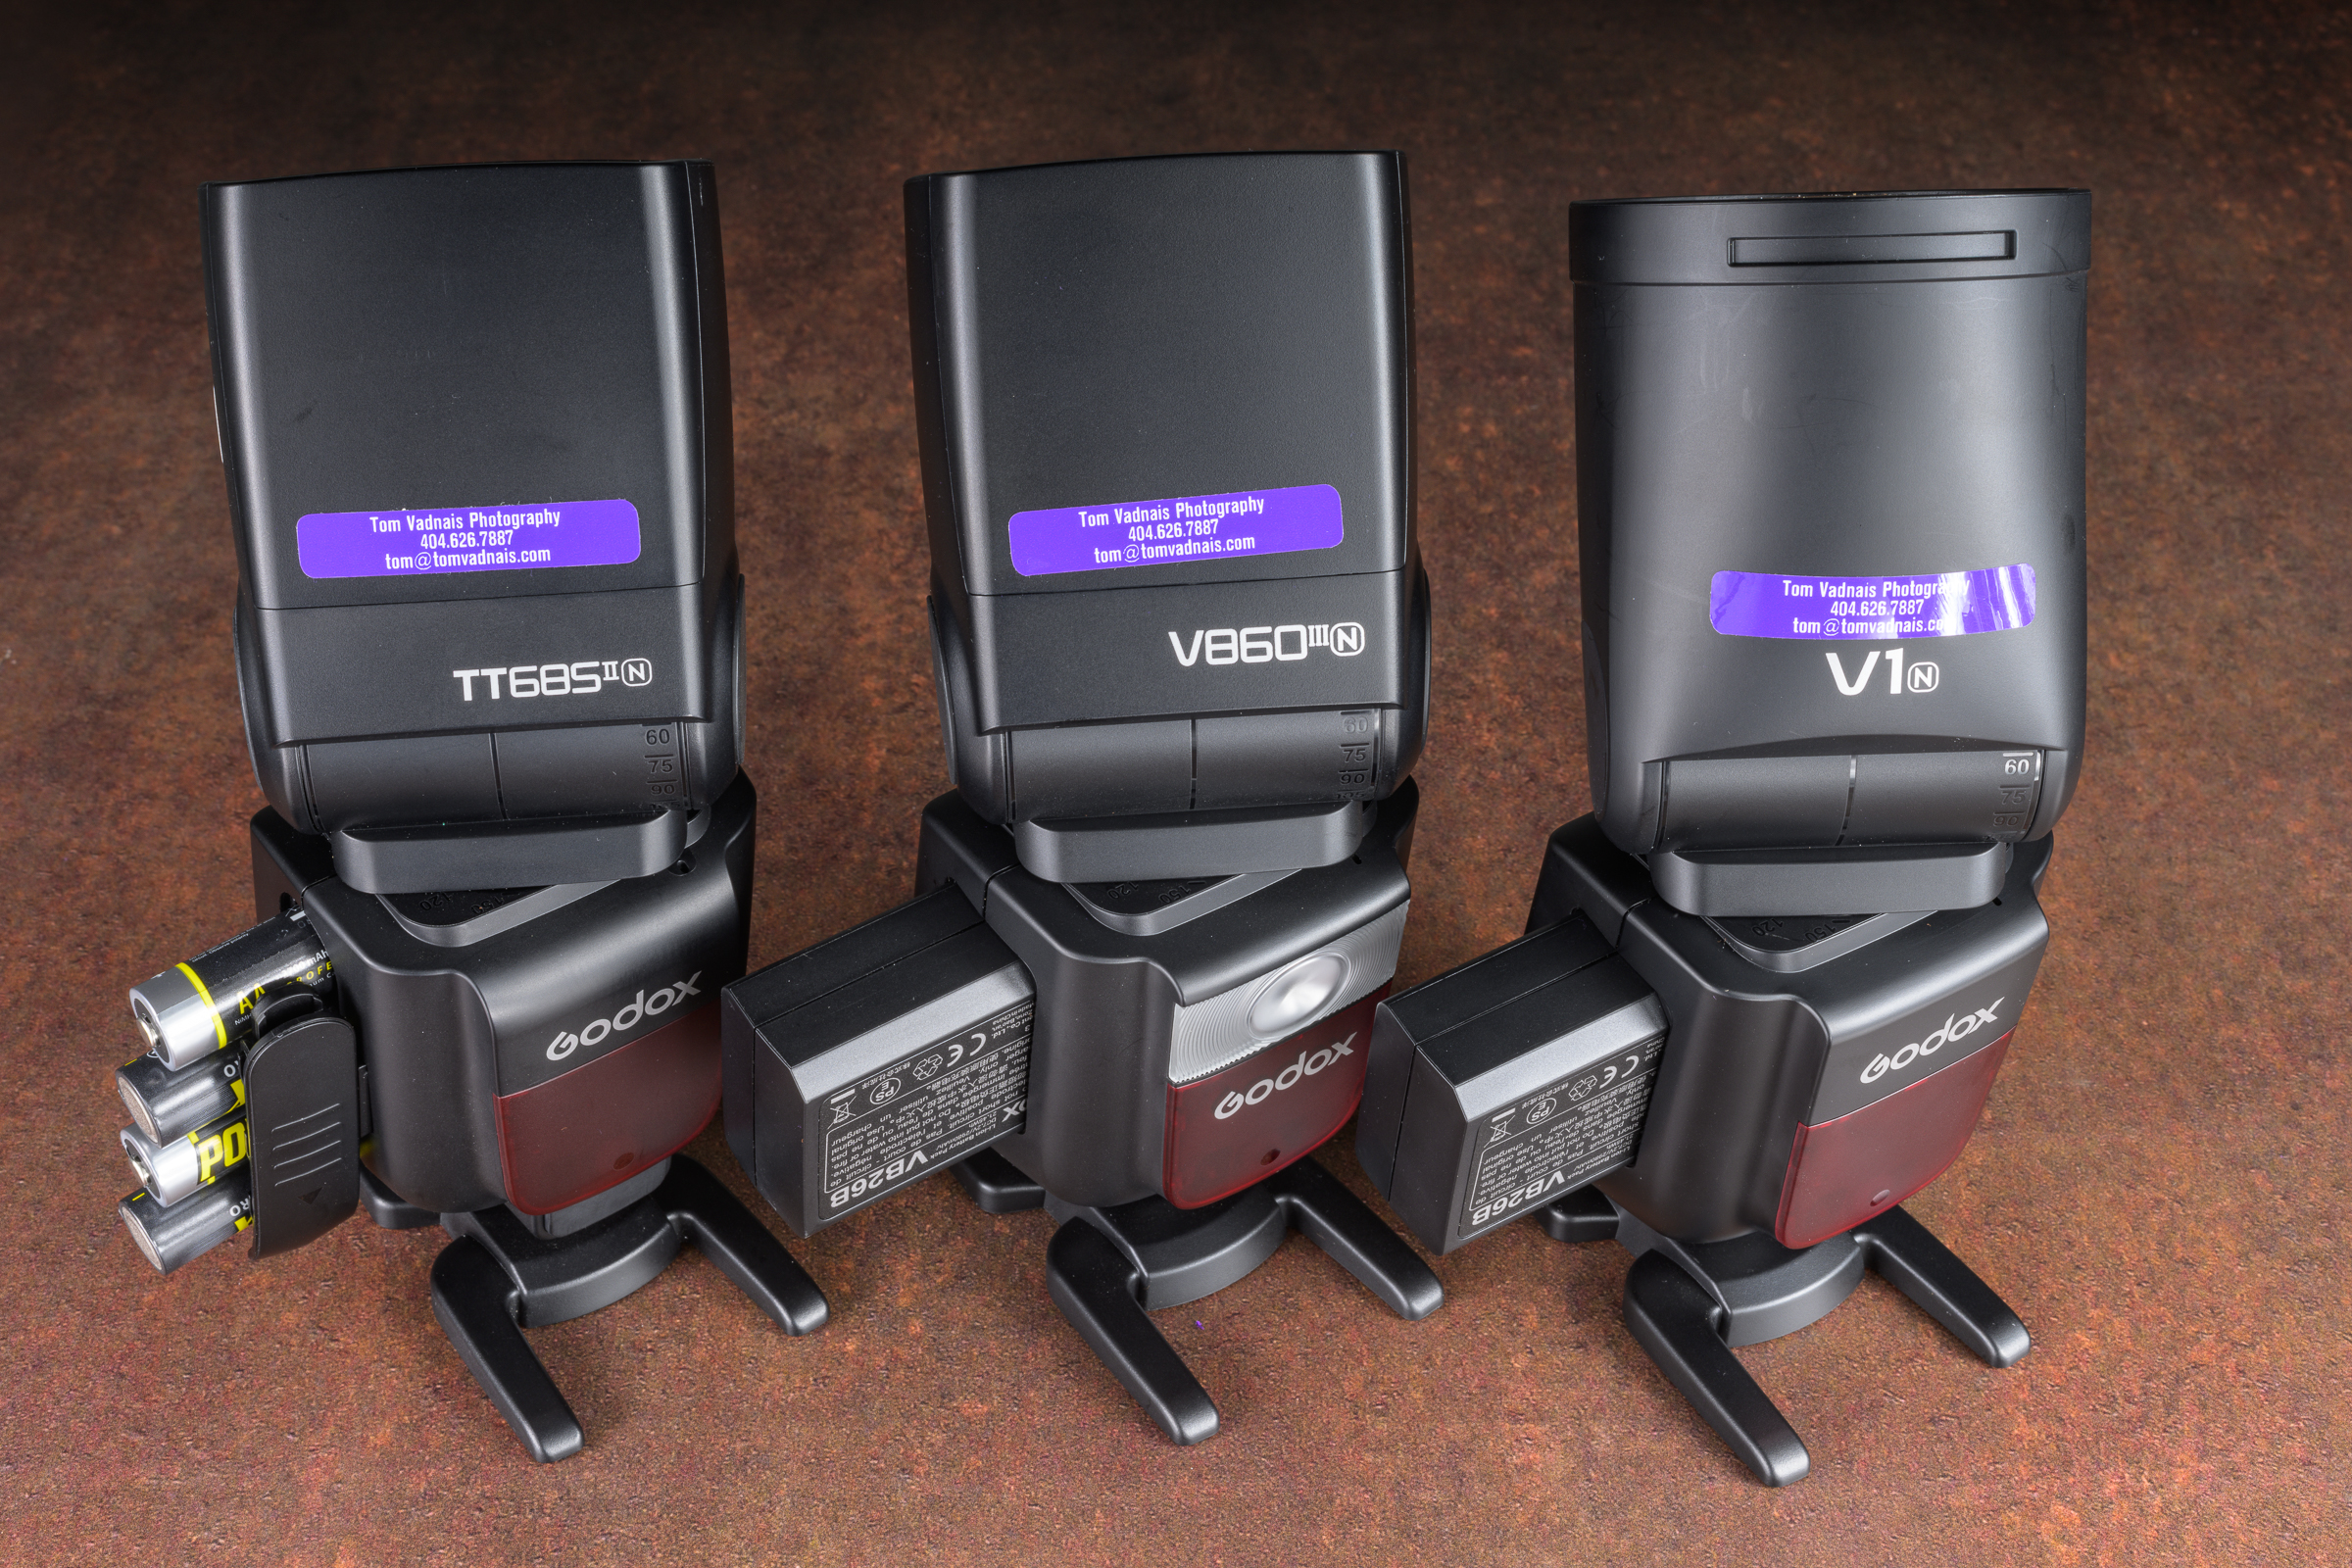
-2- Both the V860iii and V1 use proprietary lithium ion batteries. They come with one battery, but I highly suggest you buy a second for each flash to make sure you can finish your job.
The TT685ii uses four AA batteries (I’ve used Powerex Pro 2700 mAh rechargeable batteries for years). They are also compatible with external power packs for fast recharging and an almost unlimited number of flashes.
Depending on what I’m doing, I carry at least three TT685iiN flashes plus four sets of four AA rechargeable batteries between two small Think Tank battery pouches. They don’t weigh much and don’t take up much space. Best of all, if you’re out working and run out of batteries, including spares (I never have, but just in case), you can always use any universally available AA batteries. [Click on image to enlarge, then click on left arrow to return to post.]
Godox speedlite batteries with flashes on stands.
-3- Both the TT685ii and V860iii zoom from 20° to 200°, while the V1 zoom range is 28° to 105°. I use the zoom feature often to control the spread of light.
-4- The V860iii and V1 have an available modeling light, which the TT685ii lacks. I’ve never used a modeling light on studio strobes or speedlites, but if you do, this could be a deciding factor.
Please feel free to contact me if you have any questions. Happy flash shooting!
During my SAE classes (https://www.sae.org/learn/content/c1729/) and various other classes and presentations, I demonstrate and recommend Godox flashes—specifically the TT685ii. They are powerful, robust, and intuitive to use.
They have the same technical specifications and features (including: guide number 197 ft/60 m at ISO 100; fully rotating and tilting head; and, built-in radio transmitters/receivers) as the equivalent camera manufacturer’s flashes, but at only $129, cost only 12% to 22% as much! [Click on image to enlarge, then click on left arrow to return to this post.]
Godox TT685iiN mounted on Nikon Z 8, with flash head tilted up and rotated right.
In other words, you can buy 4.5 to 8.5 Godox TT685ii flashes for the price of a single camera brand flash. This means you can buy two (or three) Godox TT685ii flashes and still have plenty of money for rechargeable batteries and a charger for them. (Of course, you’ll need the batteries and a charger regardless of which flash you buy.)
For off-camera use, I highly recommend getting at least two of these flashes. I always carry at least three TT685iiN flashes, along with an X3 N hot shoe trigger so I can use all flashes off-camera if necessary. (I also use the X3 N hot shoe trigger with my Godox MF-12 macro flashes. I’ll describe them in a future post.)
Important: To use TTL (through-the-lens) flash exposure, make sure you buy flashes designed for use with your camera brand.For example, I shoot Nikon, so I use the TT685iiN versions. Godox makes versions compatible with Nikon, Canon, Sony, FUJIFILM, and Olympus/Panasonic. This allows the flashes to be used in TTL mode. [Click on image to enlarge, then click on left arrow to return to this post.]
Godox TT685 Flash Hot Shoes for different camera brands. (Made with ZEISS Milvus 50 mm f/2 Macro lens on Nikon D850 at f/16, 1/200 sec, ISO 64. One Profoto B1x strobe to each side triggered by a Nikon SB-910 flash in the camera’s hot shoe.)
In the image above, the flash at the far left (“M”) is a full manual(non-camera specific, non-TTL) model. It has a single contact to allow the camera to fire the flash with fully manual settings (except with Sony cameras). The other flashes, from left to right, are Nikon, Canon, FUJIFILM, Olympus/Panasonic, and Sony.
Note that any flash may be used in full manual mode with any camera brand—except with Sony. The pin that fires the flash is offset on the Sony proprietary hot shoe (far right in photo above), so it doesn’t reliably fire a non-Sony flash—if fires it at all. Sony’s proprietary hot shoe means a Sony-compatible flash must be used on a Sony camera. It also means that Sony-specific flashes will not work in non-Sony camera hot shoes (although they will work as remote flashes).
I’ve been using TT685iiN flashes (I have six of them) almost daily since their release almost four years ago without a single problem or malfunction. I previously used the original TT685N flashes (I have three of them) without any issue. I also have bought another twenty or so TT685ii flashes for other camera brands for students to use in my classes. (Full disclosure: I am not affiliated with Godox. I just use and like their stuff!)
Note: The Godox V860iii is identical to the TT685ii, but it includes a proprietary rechargeable lithium-ion battery, and costs $100 more. The Godox V1 is identical to the V860iii, but has a round head and costs $30 more than the V860iii and $130 more than the TT685ii). All three flash models are fully interchangeable as on-or-off camera flashes with the Godox radio control system. A future post will illustrate and describe the differences between the Godox flash models.
Regardless of what flash brand you get, I strongly encourage you to get at least two flashes. Two flashes allow you to use the off-camera flash to fill in shadows and for side lighting to bring out textures, stampings, and raised lettering or elements. You’ll find they are something you’ll use almost daily in your forensic photography.
Takeaways:
-1- Godox TT685ii, V860iii, and V1 are well-made, robust, powerful, and intuitive flashes that cost much less than, but have the same performance specs as, flashes sold by camera manufacturers.
-2- This significantly lower cost makes it easy to buy two or more flashes, plus rechargeable batteries and a battery charger, for less money than a single camera manufacturer’s flash.
-3- Two flashes allow you to use the off-camera flash to fill in shadows and for side lighting to bring out textures, stampings, and raised lettering or elements.
-4- You need to make sure at least one of your flashes is compatible with your camera brand so you can use TTL (through-the-lens) flash exposure.
-5- If you don’t need or want light coming from a flash in your camera’s hot shoe, adding an X3 or X3 Pro hot shoe trigger will allow you to use all your flashes off camera, even in TTL.
Both 1/80 sec, ISO 200 made using Nikon D3s with Nikon 24-70 mm f/2.8 lens at 50 mm. Left without polarizer f/14. Right with polarizer f/11.
[Click on image to enlarge, then click back arrow to return to this post.]
SAE will once again be hosting my class C1729 entitled Photography for Accident Reconstruction, Product Liability, and Testing from March 18-20, 2025. This time it will be in Peoria, AZ.
We will start with the basics of camera setup, menus, exposure, and gear (especially flashes, tripods, and polarizers). We will build on that with composition and focusing. There will be plenty of comparison images between bad and good images so we can see how and why images can be improved to show more detail and become more useful.
We will also discuss the special requirements and procedures for macro (close-up) and night photography, along with the importance of proper perspective. Finally, we will review file handling and post-processing.
We will have extended hands-on sessions to apply what we’ve learned to real world situations. As always, I will be bringing additional flashes, tripods, and polarizers for those who don’t have them, or who don’t have good ones, or who want to try new equipment.
When inspecting a truck and downloading its HVEDR, it is important to document the actual tire parameters. This includes not only confirming tires sizes, but their load ranges. You must confirm that the tire sizes and load ranges match those on the safety certification label on the door jamb and in the values programmed into the HVEDR.
In its 2023 Truck Tire Data Book, Michelin summarizes the effects of different revs/mile in this Rule of Thumb: “When going from a lower Tire Revs./Mile [sic] to a higher Tire Revs./Mile, the actual vehicle speed is less than the speedometer reading. When going from a higher Tire Revs./Mile to a lower Tire Revs./Mile, the actual vehicle speed is greater than the speedometer reading.”
The revs/mile differences between load ranges in a given tire size might not be large, but they do exist—even in the same line of tires. For example, Michelin lists two 11R22.5 X Multi D tires: one load range G and the other load range H. For the load range G tire, Michelin lists the revs/mile as 496 while it lists 494 revs/mile for the load range H tire. Likewise, for the 11R22.5 Michelin X Line Energy Z tire line, the load range G revs/mile was 502 and the load range H was 503.
So just between two Michelin tire lines, there is a range of revs/mile from 494 to 503 for 11R22.5 tires. Not only that, but for one tire line, revs/mile were higher for the LRH tire than the LRG, while for the other tire line, the opposite was true.
At first it may seem that all tires of the same size would have the same revs/mile. But variations in tire construction, tread design, and tread depth can result in small variations in the actual revs/mile of a specific tire of the same size.
Tire companies determine the revs/mile from the test procedures set out in SAE Recommended Practice J1025. J1025 specifies speed (45 mph), load, inflation pressure, ambient temperature, configuration, break-in, warm up, surfaces, measurement devices, and test distances required for each test.
The four revs/mile values of the four 11R22.5 Michelin tires above weren’t far apart, but it is best to check and confirm. And even though a small difference in revs/mile may not end up being significant in your analysis, you want to confirm that the truck tires sizes and load ranges matched what was used when programming the HVEDR.
Many trucks have a variety of tire brands, sizes, load ranges, or a mixture of original and retreaded tires. In some cases, the truck may be gone or repaired, and all you have to work with is the HVEDR report itself. When you have tire variations or unknown tires, you might consider researching the ranges of any relevant tire property, like revs/mile, then running a sensitivity analysis to quantify the effect that range of values might have on any subsequent analysis involving data from the report.
Takeaways:
-1- During a truck inspection, don’t just document the tire manufacturer(s) and tire size(s), but be sure to include the tire load range(s). Compare their properties with the programmed values in the HVEDR report.
-2- If there are variations in the truck’s tires, check the various tire properties against the HVEDR programmed values.
-3- Using those tire property variations, it might be useful to perform a sensitivity analysis to quantify the effect of a range of revs/mile or other variable.
-4- To learn how to apply HVEDR data, I highly recommend SAE International class C1901 Advanced Applications of Heavy Vehicle EDR Data taught by Wes Grimes, Greg Wilcoxson, Dave Plant, and Brad Higgins: https://www.sae.org/learn/content/c1901/
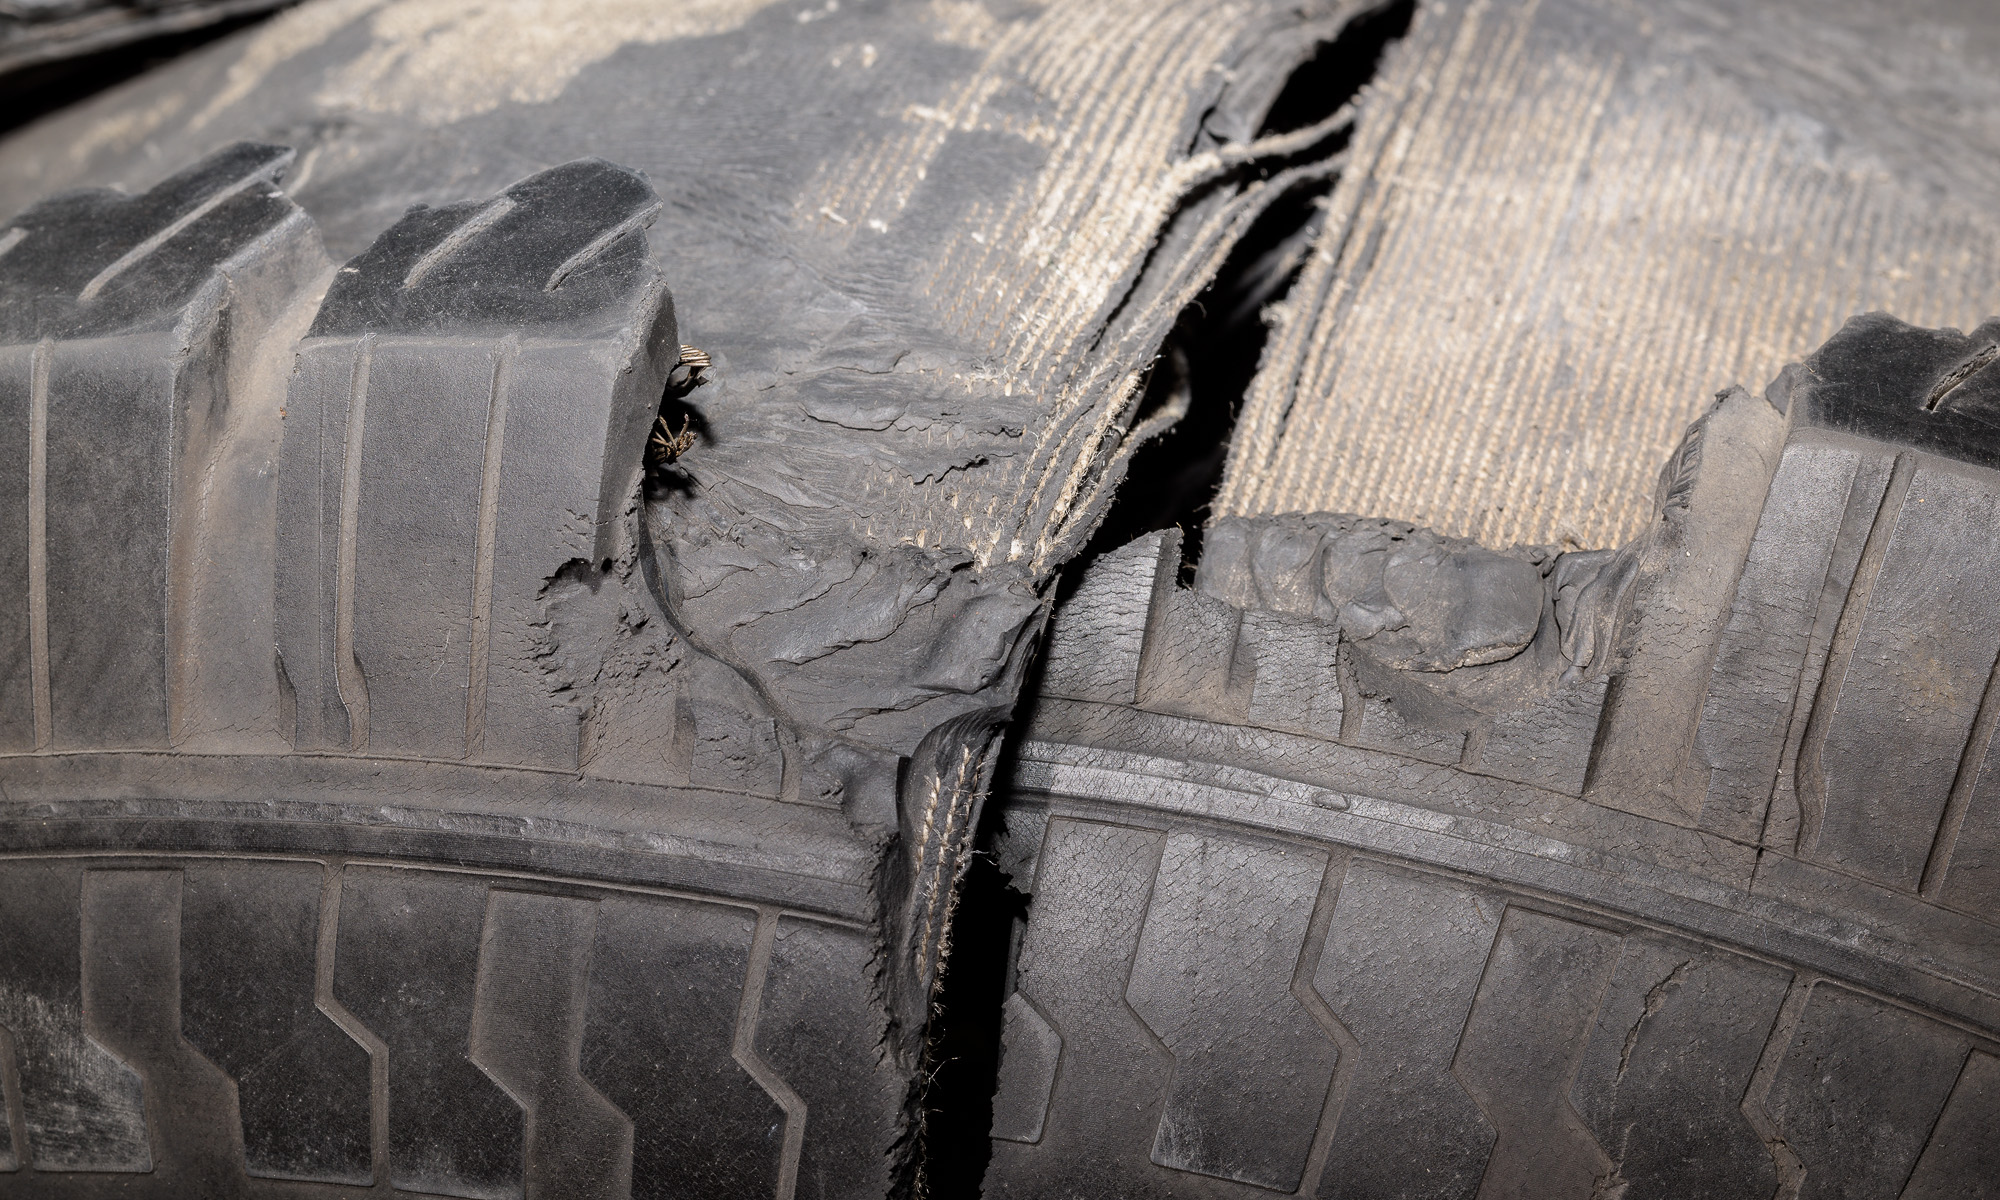
It is essential to keep truck tires properly inflated so they can carry the load, wear evenly, maximize fuel mileage, and maintain their integrity. Chronic overdeflection (overinflation, underinflation, or a combination) is a common cause or contributor to tire failures.
During pre-trip inspections, the Federal Motor Carrier Safety Regulations (49 CFR §396.13) requires the driver “be satisfied that the motor vehicle is in safe operating condition.” This includes the truck’s tires . As part of that pre-trip tire inspection, a driver is trained to look for low or flat tires. But there is no requirement that the driver check the air pressure with a gauge. In fact, while going through truck driving school before getting my CDL, we never once used an air pressure gauge during our pre-trip inspection lessons, daily routines, or exams.
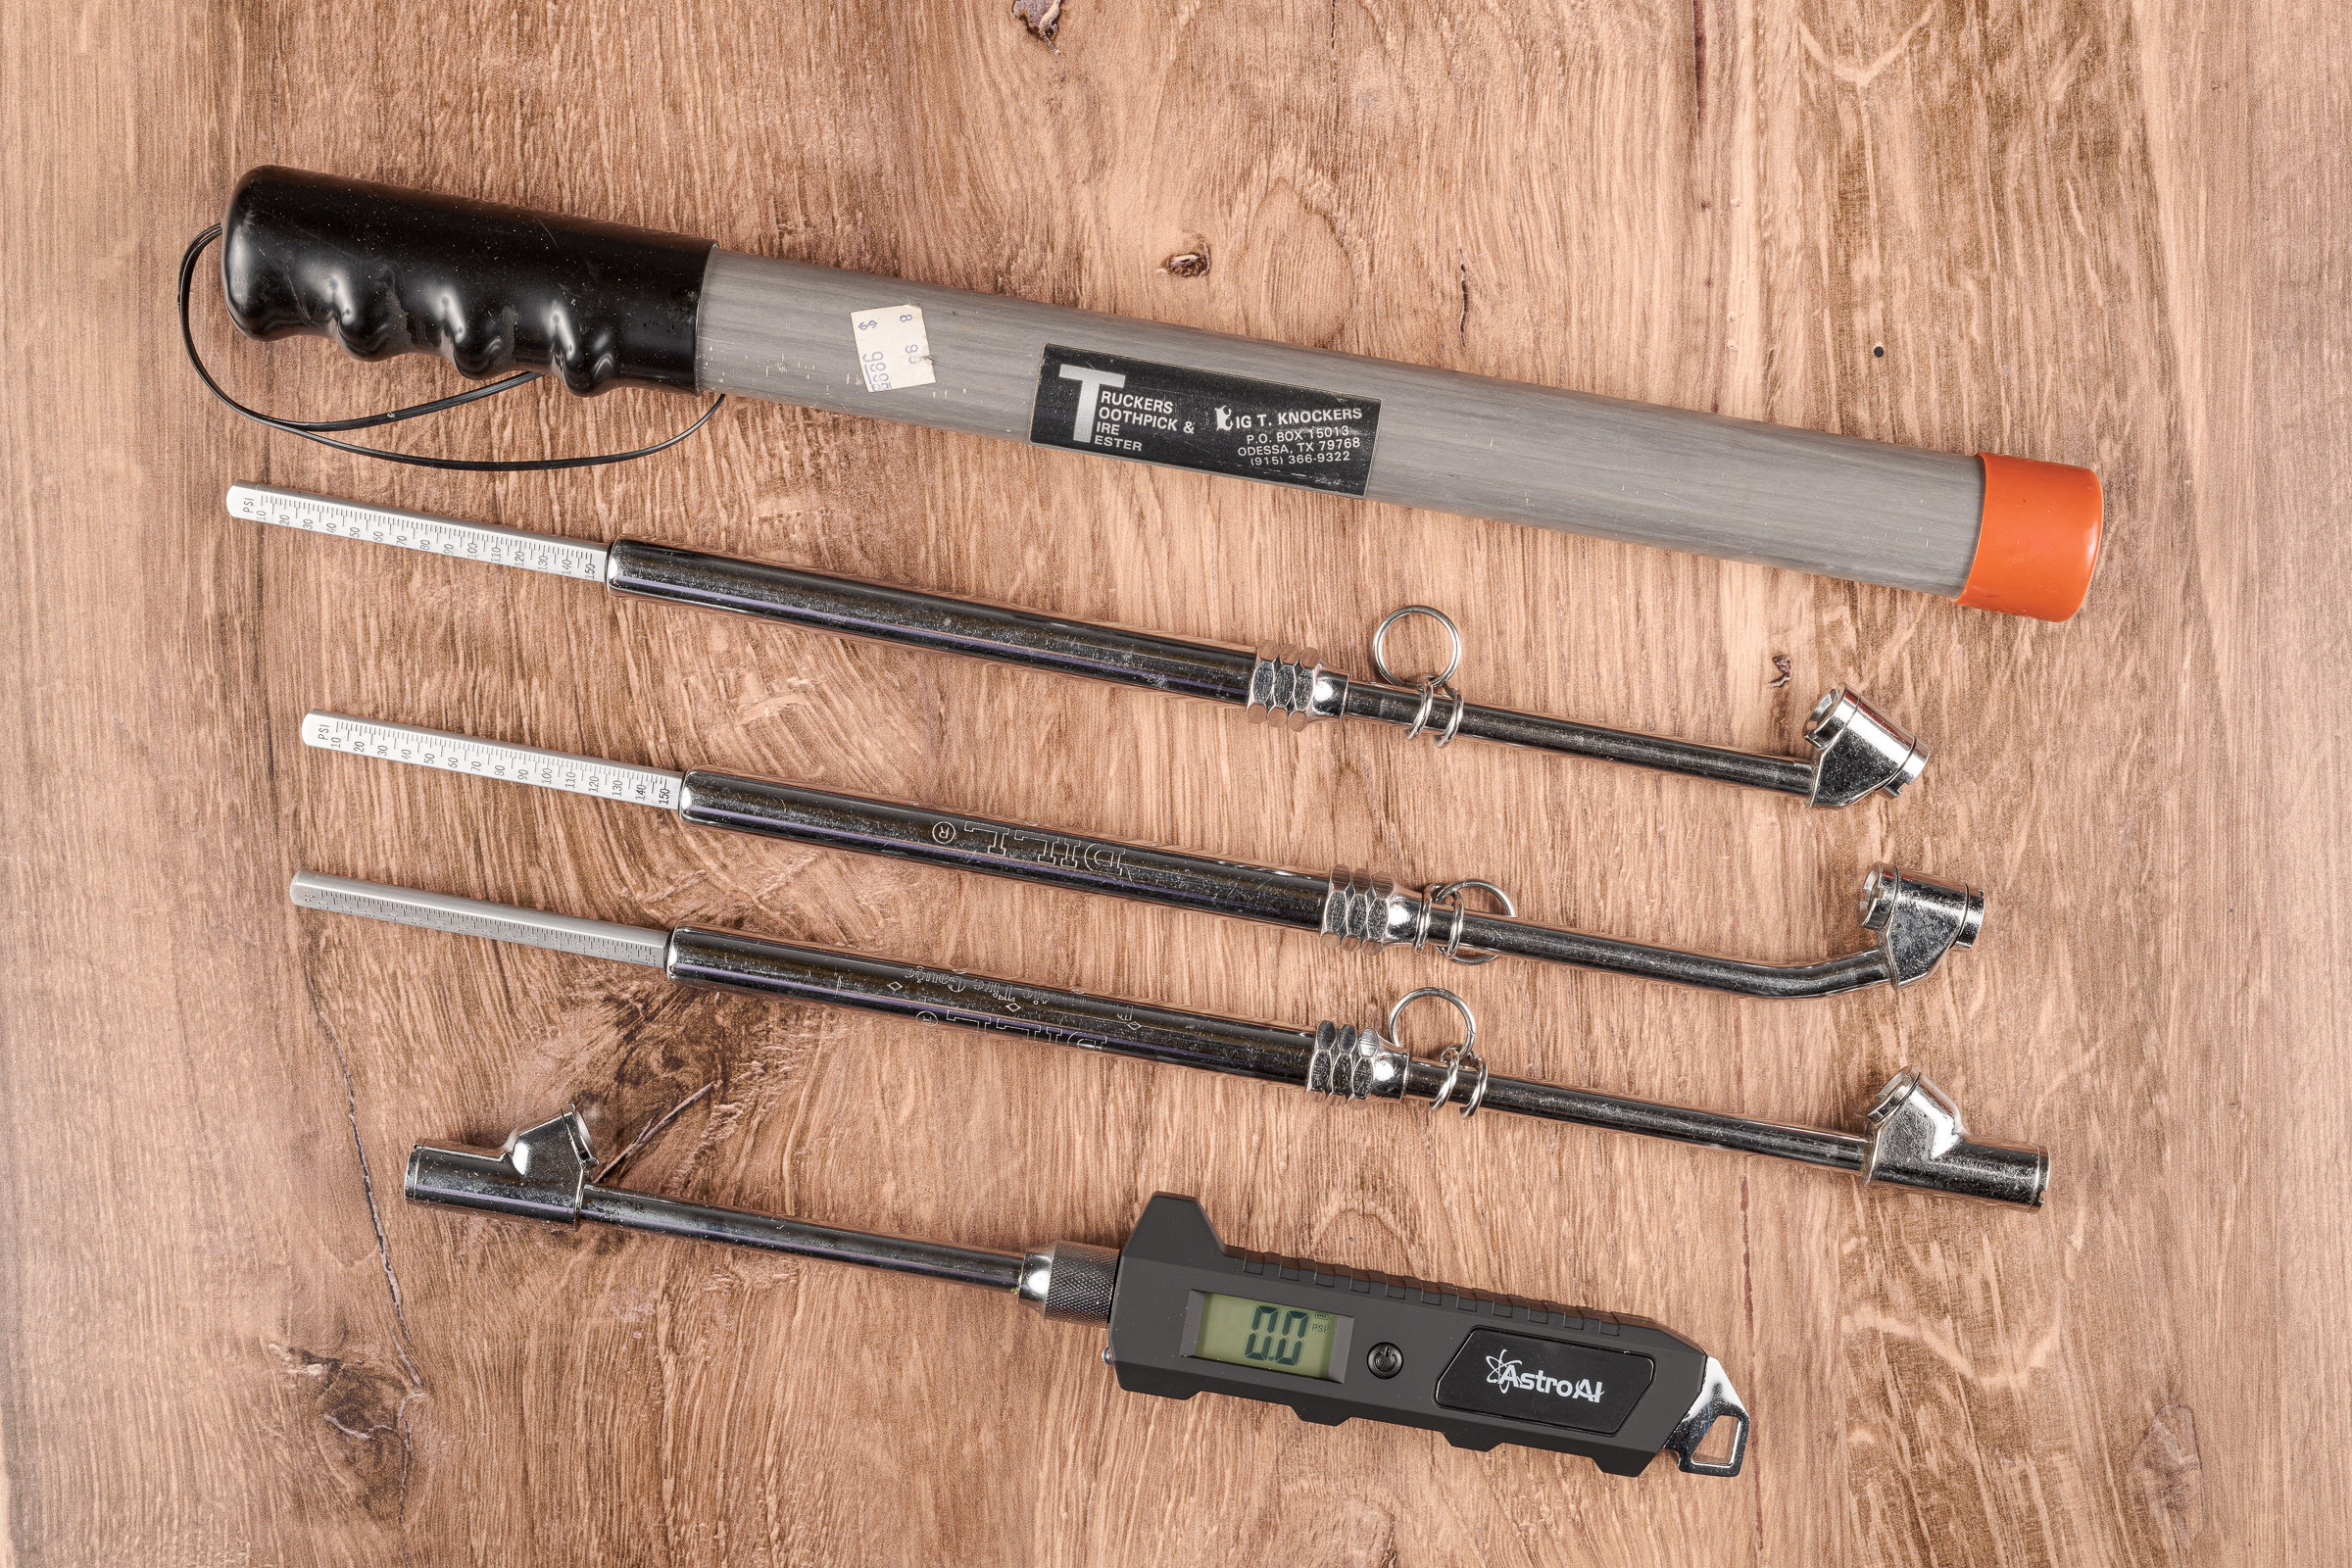
It would be an onerous task to require a driver to check the air pressure of all eighteen tires on a typical tractor trailer before every trip. As an alternative to a gauge, some drivers use a “tire thumper” (usually a rubber mallet or some kind of a bat) to check their tires. If a tire is inflated, the thumper would bounce right off. Striking a tire with little or no air would have no bounce back, but would respond with a flat thud. While a thumper can’t determine if a tire is properly inflated, it can let you know if a tire is flat or near flat. [Click on image to enlarge, then click back arrow to return to this post.]
Only the bottom four of these will give you an accurate truck tire inflation pressure. (Made with ZEISS Milvus 50 mm f/2 Macro lens on Nikon D850 at f/16, 1/200 sec, ISO 64. Used one Profoto B1x studio strobe with silver umbrella with diffuser on each side.)
Back in 1998, I bought the Trucker’s Toothpick & Tire Tester at the top of the photo at a truck stop just for fun. (Both the name of the product and the company are rather whimsical.) It is a weighted metal stick with a hand grip on one end and a protective cover on the other. Along with various wooden bats, it is typical of tire thumpers sold commercially. While their benefits are minimal, at least thumpers prevent a driver from starting off on a trip with a flat tire.
The three stick gauges in the middle of the photo look similar, but their dual heads are at different angles. One of them is bound to fit when the metal valve stems of either the inner or outer tire of a dual pair are bent and otherwise inaccessible. They prevent you from bleeding air out of the tire as you try to get the gauge head to seat on the valve.
Stick gauges seem tricky to read until you understand how their scale works. I’ll describe that below.
The digital pressure gauge at the bottom is the easiest to read (and photograph, if you do that—I don’t).
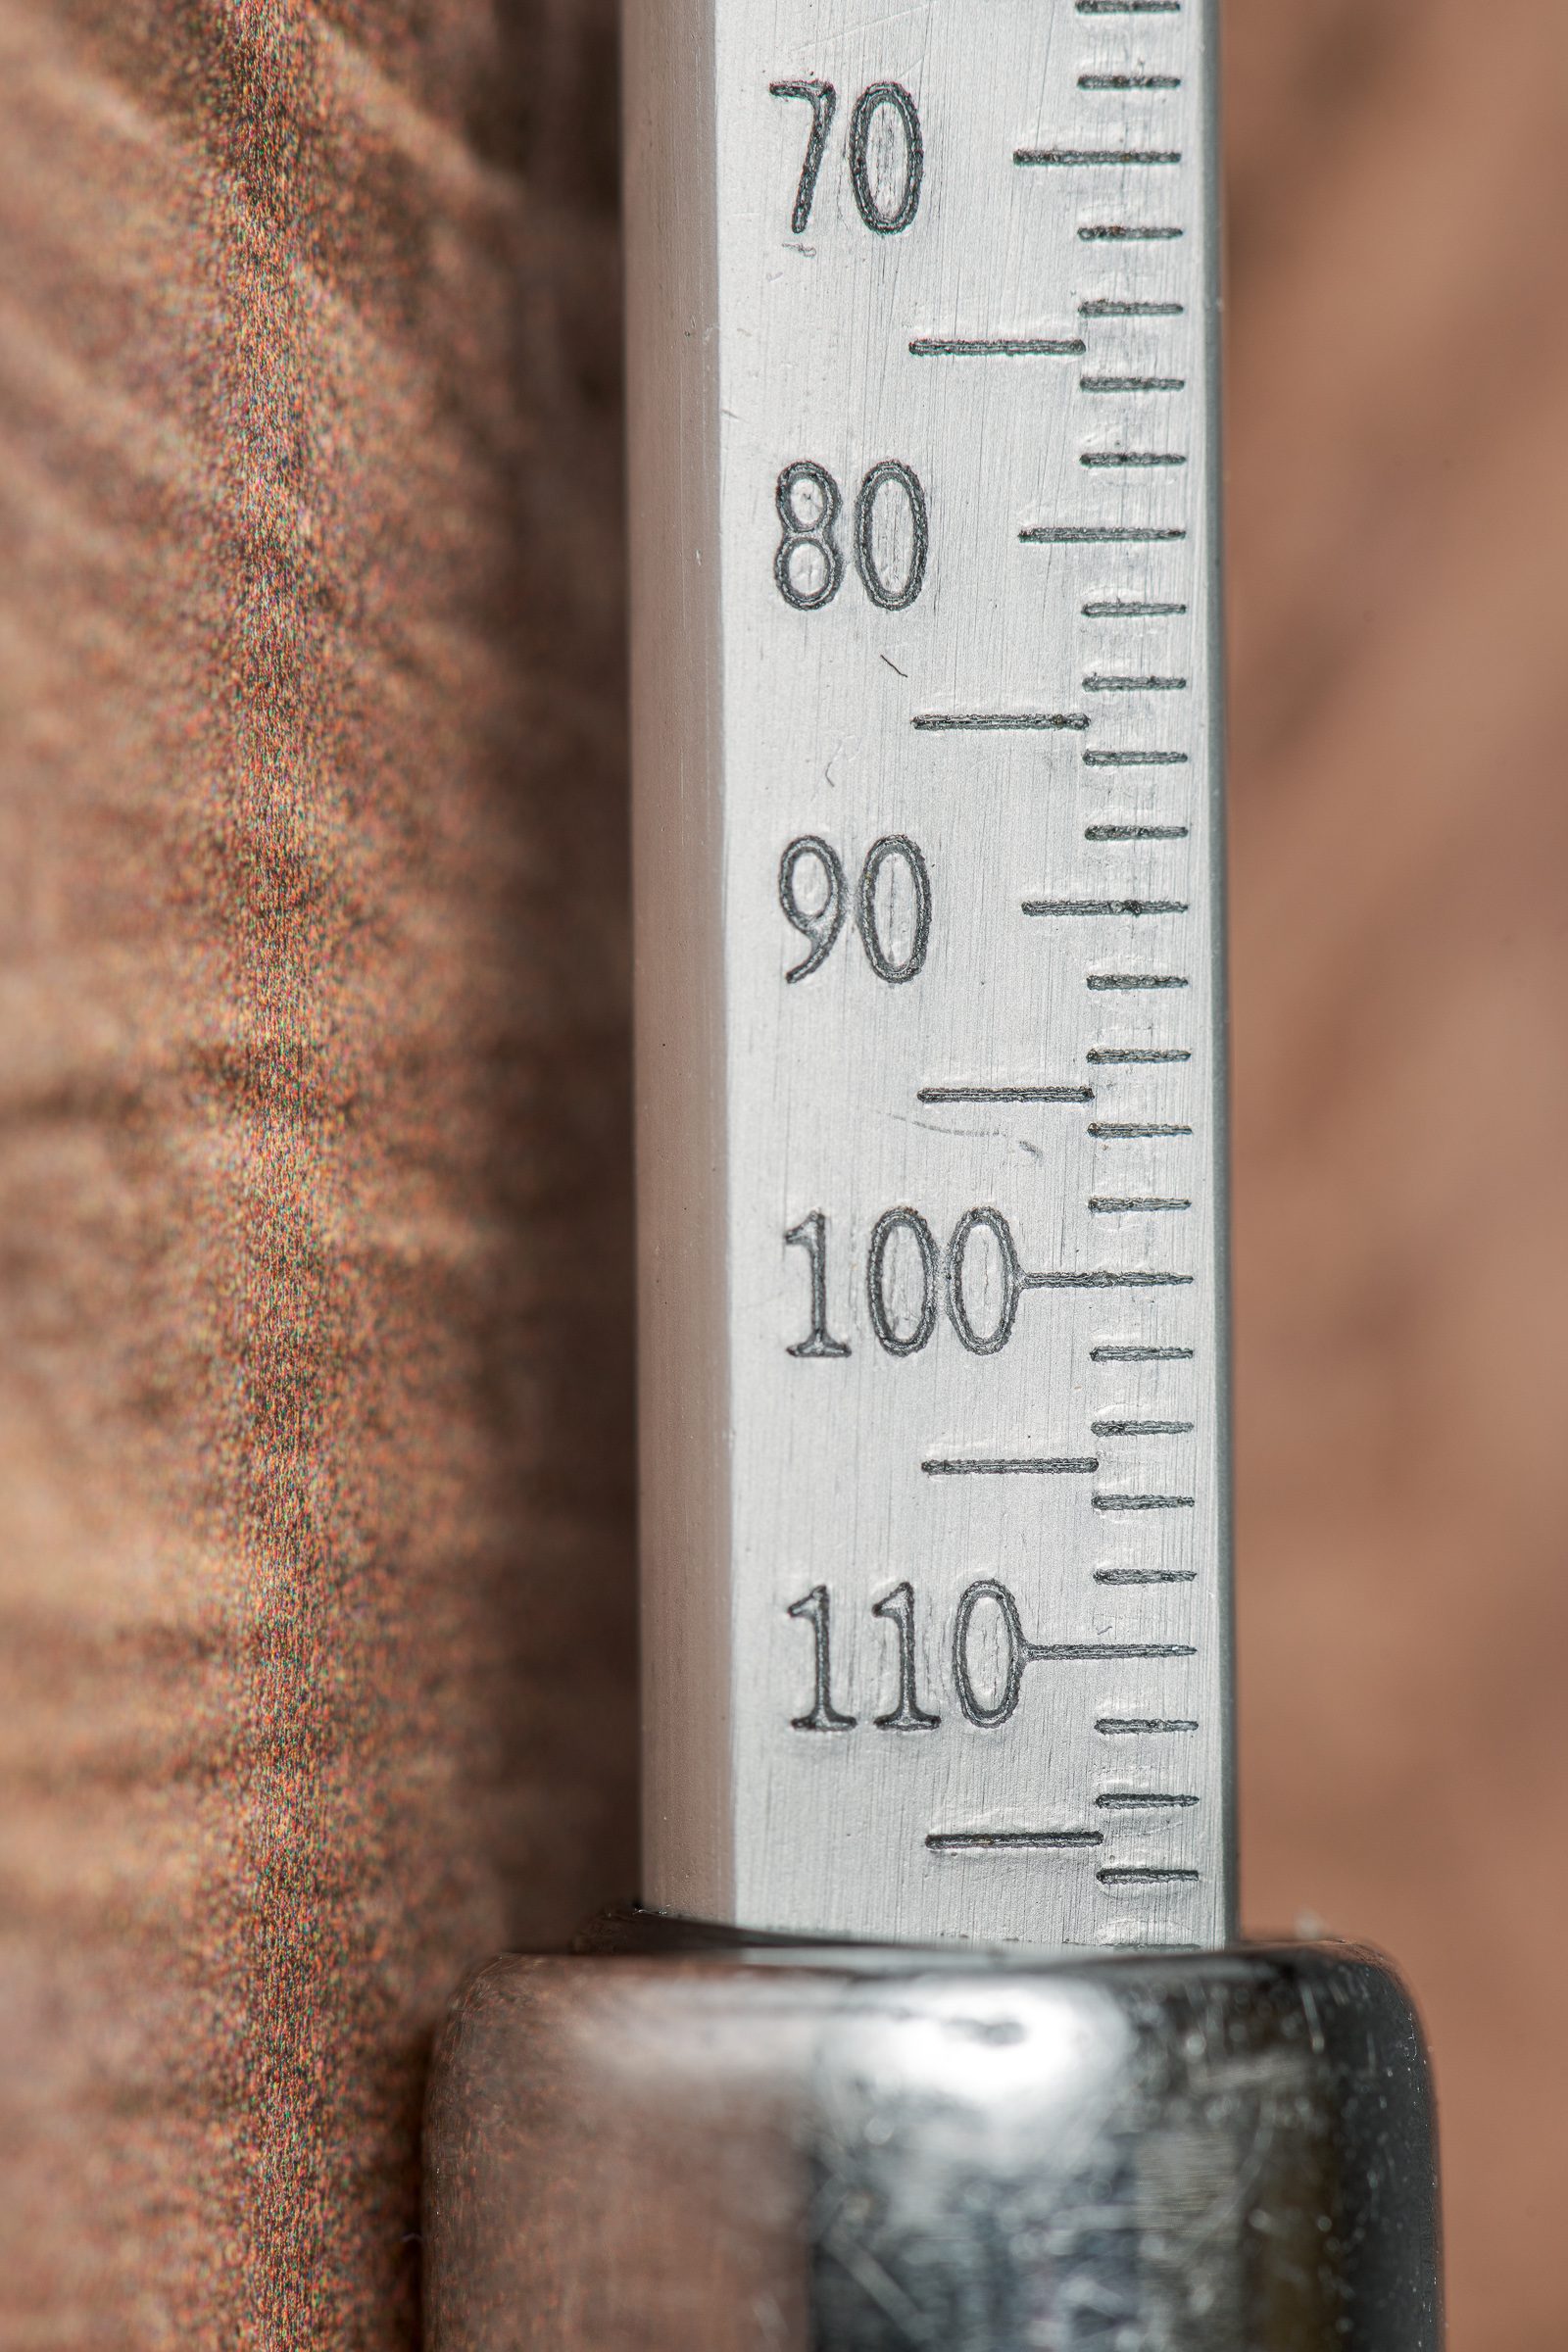
Here’s how to read a truck tire stick gauge. Assume you’ve just checked the air pressure of a steer axle tire and got the reading below. [Click on image to enlarge, then click back arrow to return to this post.]
Scale on truck tire inflation pressure gauge. (Made with Nikon 105 mm Micro lens on Nikon D850 at f/16, 1/200 sec, ISO 64. Used one Profoto B1x studio strobe with silver umbrella with diffuser on each side.)
At first glance, the scale might not seem to make sense with the decimals between the longest hash marks. (Gauges typically start at 10 psi, not 0 psi; anything less than 10 psi is obviously flat.)
Zooming in might help make deciphering the scale more clear. (This photo has been rotated clockwise to be oriented as you would read the scale in use.) [Click on image to enlarge, then click back arrow to return to this post.]
Rotated close-up of scale on truck tire inflation pressure gauge.(Made with Nikon 105 mm Micro lens on Nikon D850 at f/16, 1/200 sec, ISO 64. Used one Profoto B1x studio strobe with silver umbrella with diffuser on each side.)
Let’s start with the 100 psi mark. (Note that on this gauge, the 100 psi hash mark happens to intersect the second zero.) The next short hash mark down represents 102 psi. One shorter hash mark down is 104 psi. Just below that, the longer hash mark near the center of the scale represents 105 psi. The next short hash mark at the right edge below that is 106 psi. Below that, the short hash mark is 108 psi. Next is the longer hash mark for 110 psi. Using this information, you can see the inflation pressure reading above was 118 psi.
To summarize, all the hash marks along the right edge of the scale are in 2 psi increments. Half way between the decimals, the longer hash marks near the center of the scale are in 5 psi increments.
Anywhere along the scale, anytime the end of the barrel is halfway between two consecutive short hash marks, the inflation pressure is 1 psi greater than the short hash mark above it.
Takeaways:
-1- While truck tires must be properly inflated, the Federal Motor Carrier Safety Regulations do not require truck drivers to check tire inflation pressures with a gauge during their pre-trip inspections.
-2- Tire thumpers can indicate if a tire is flat or almost flat, but cannot determine the inflation pressure.
-3- Different angles of dual head inflation pressure gauges can help access bent valve stems.
-4- If using a stick gauge, make sure you accurately read the scale.
Tire pressure monitoring systems (TPMS) are required on cars, pickups, and SUVs, and can be found on some heavy trucks. A TPMS simply warns the driver that the air pressure in a tire dropped to a certain pressure, or dropped a certain percent below the programmed pressure. TPMS does not replenish the air.
Onboard tire inflation systems, which are becoming common on air-braked trucks, semi-trailers, and buses, use the onboard air system to maintain the appropriate air pressure in each tire. Truck tire inflation systems only warn a driver if a tire loses air faster than the system can replenish it.
During routine maintenance, after a tire issue, or after an accident, you will often want to check all tire inflation pressures, even if there is a tire monitoring system or an onboard inflation system. You’ll need to ensure that either type of system was working properly. That requires checking each tire pressure individually.
With either system, how to you access the valve for each tire? Below are two examples.
First is a Stemco AirBat RF tire monitoring system on the rear tandems of a three-axle truck tractor. (Click on image to enlarge, then click on back arrow to return to this post.)
Stemco AirBat RF assembled. (Made using Nikon D850 with ZEISS Milvus 50 mm macro lens and Nikon SB-910 flash.)
There are two standard metal valve caps—one for each tire of the dual. Remove these caps and use a truck tire pressure gauge as you normally would. You can also add air through these valves if required. (Click on image to enlarge, then click on back arrow to return to this post.)
Stemco AirBat RF with valve caps off. (Made using Nikon D850 with ZEISS Milvus 50 mm macro lens and Nikon SB-910 flash.)
Make sure you know which valve goes to which tire. It’s easy to do; just trace the hose back to its associated wheel.
As an example of tire inflation systems, the Meritor Tire Inflation System by P.S.I. (MTIS) is a popular system on both new and retrofitted semi-trailers. (Click on image to enlarge, then click on back arrow to return to this post.)
MTIS by P.S.I. assembled. (Made using Nikon D850 with ZEISS Milvus 50 mm macro lens and Nikon SB-910 flash.)
With MTIS, twist the knurled fitting at either end of the through tee, then use your truck tire pressure gauge on the valve at the end of each hose. Again, make sure you trace which hose goes to which tire. (Click on image to enlarge, then click on back arrow to return to this post.)
MTIS by P.S.I. valve stem. (Made using Nikon D850 with ZEISS Milvus 50 mm macro lens and Nikon SB-910 flash.)
While these systems initially look intimidating, it is actually much easier to check tire inflation pressures with them than it is trying to get a tire gauge to fit on individual valve stems on the wheels.
I’m sure you’ve seen many photos like the one below. [Click on image to enlarge, then click back arrow to return to this post.]
Left front of truck with bad composition. (Nikon D850 with ZEISS Milvus 50 mm f/2 macro lens and Nikon SB-910 fill flash.)
What is the subject? The tire and wheel? The intruding part at the upper right (which was actually from an unrelated truck)? The gravel? Is there something important that I should be seeing in the gravel?
It was actually the tire and wheel. But if you draw a vertical line down the middle of the photo, almost the entire right half of it is unrelated to the subject.
In the image below, the tire and wheel are still featured, but now you can see how they relate to part of the truck’s frame rail and steering system, too. [Click on image to enlarge, then click back arrow to return to this post.]
Left front of truck with good composition. (Nikon D850 with ZEISS Milvus 50 mm f/2 macro lens and Nikon SB-910 fill flash.)
This photo makes more sense and eliminates unnecessary and confusing elements. It’s easy to pay so much attention to your subject that you forget what it looks like in the frame. Make sure you haven’t included too much empty space or too many unrelated elements that are not only distracting and confusing, but look sloppy, careless, and unprofessional.
While working so intensely together to conduct testing for publication, it is worth taking the time to make photographs of all those who participated. The photos can be useful for a report, any paper presentations, and the websites of the participants. (Click on image below to enlarge, then click on back arrow to return.)
Three testing partners with tractor trailer (ZEISS 50 mm f/2 macro lens on Nikon D810.)
From left to right are truck and truck ECM guru Greg Wilcoxson (Wilcoxson Consulting, LLC), truck, data acquisition, and, well, everything else guru Wes Grimes (Wes Grimes, Collision Engineering Associates), and me. In an earlier post, you’ll find a link to the papers we wrote together from this testing.
Even with my hat, I was hardly in their league. We did have fun in the evenings when I would walk into a restaurant first, and tell the hostess or host that I was their bodyguard, and needed to get them a good table. We should have recorded their reactions.
A photograph of something as long as a tractor trailer is often best presented in a panoramic format (much wider than tall). This focuses attention on the subject by eliminating excessive sky and foreground.
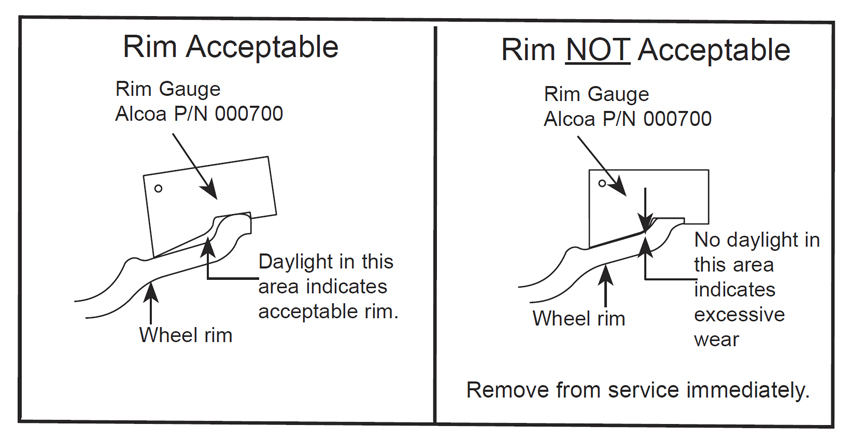
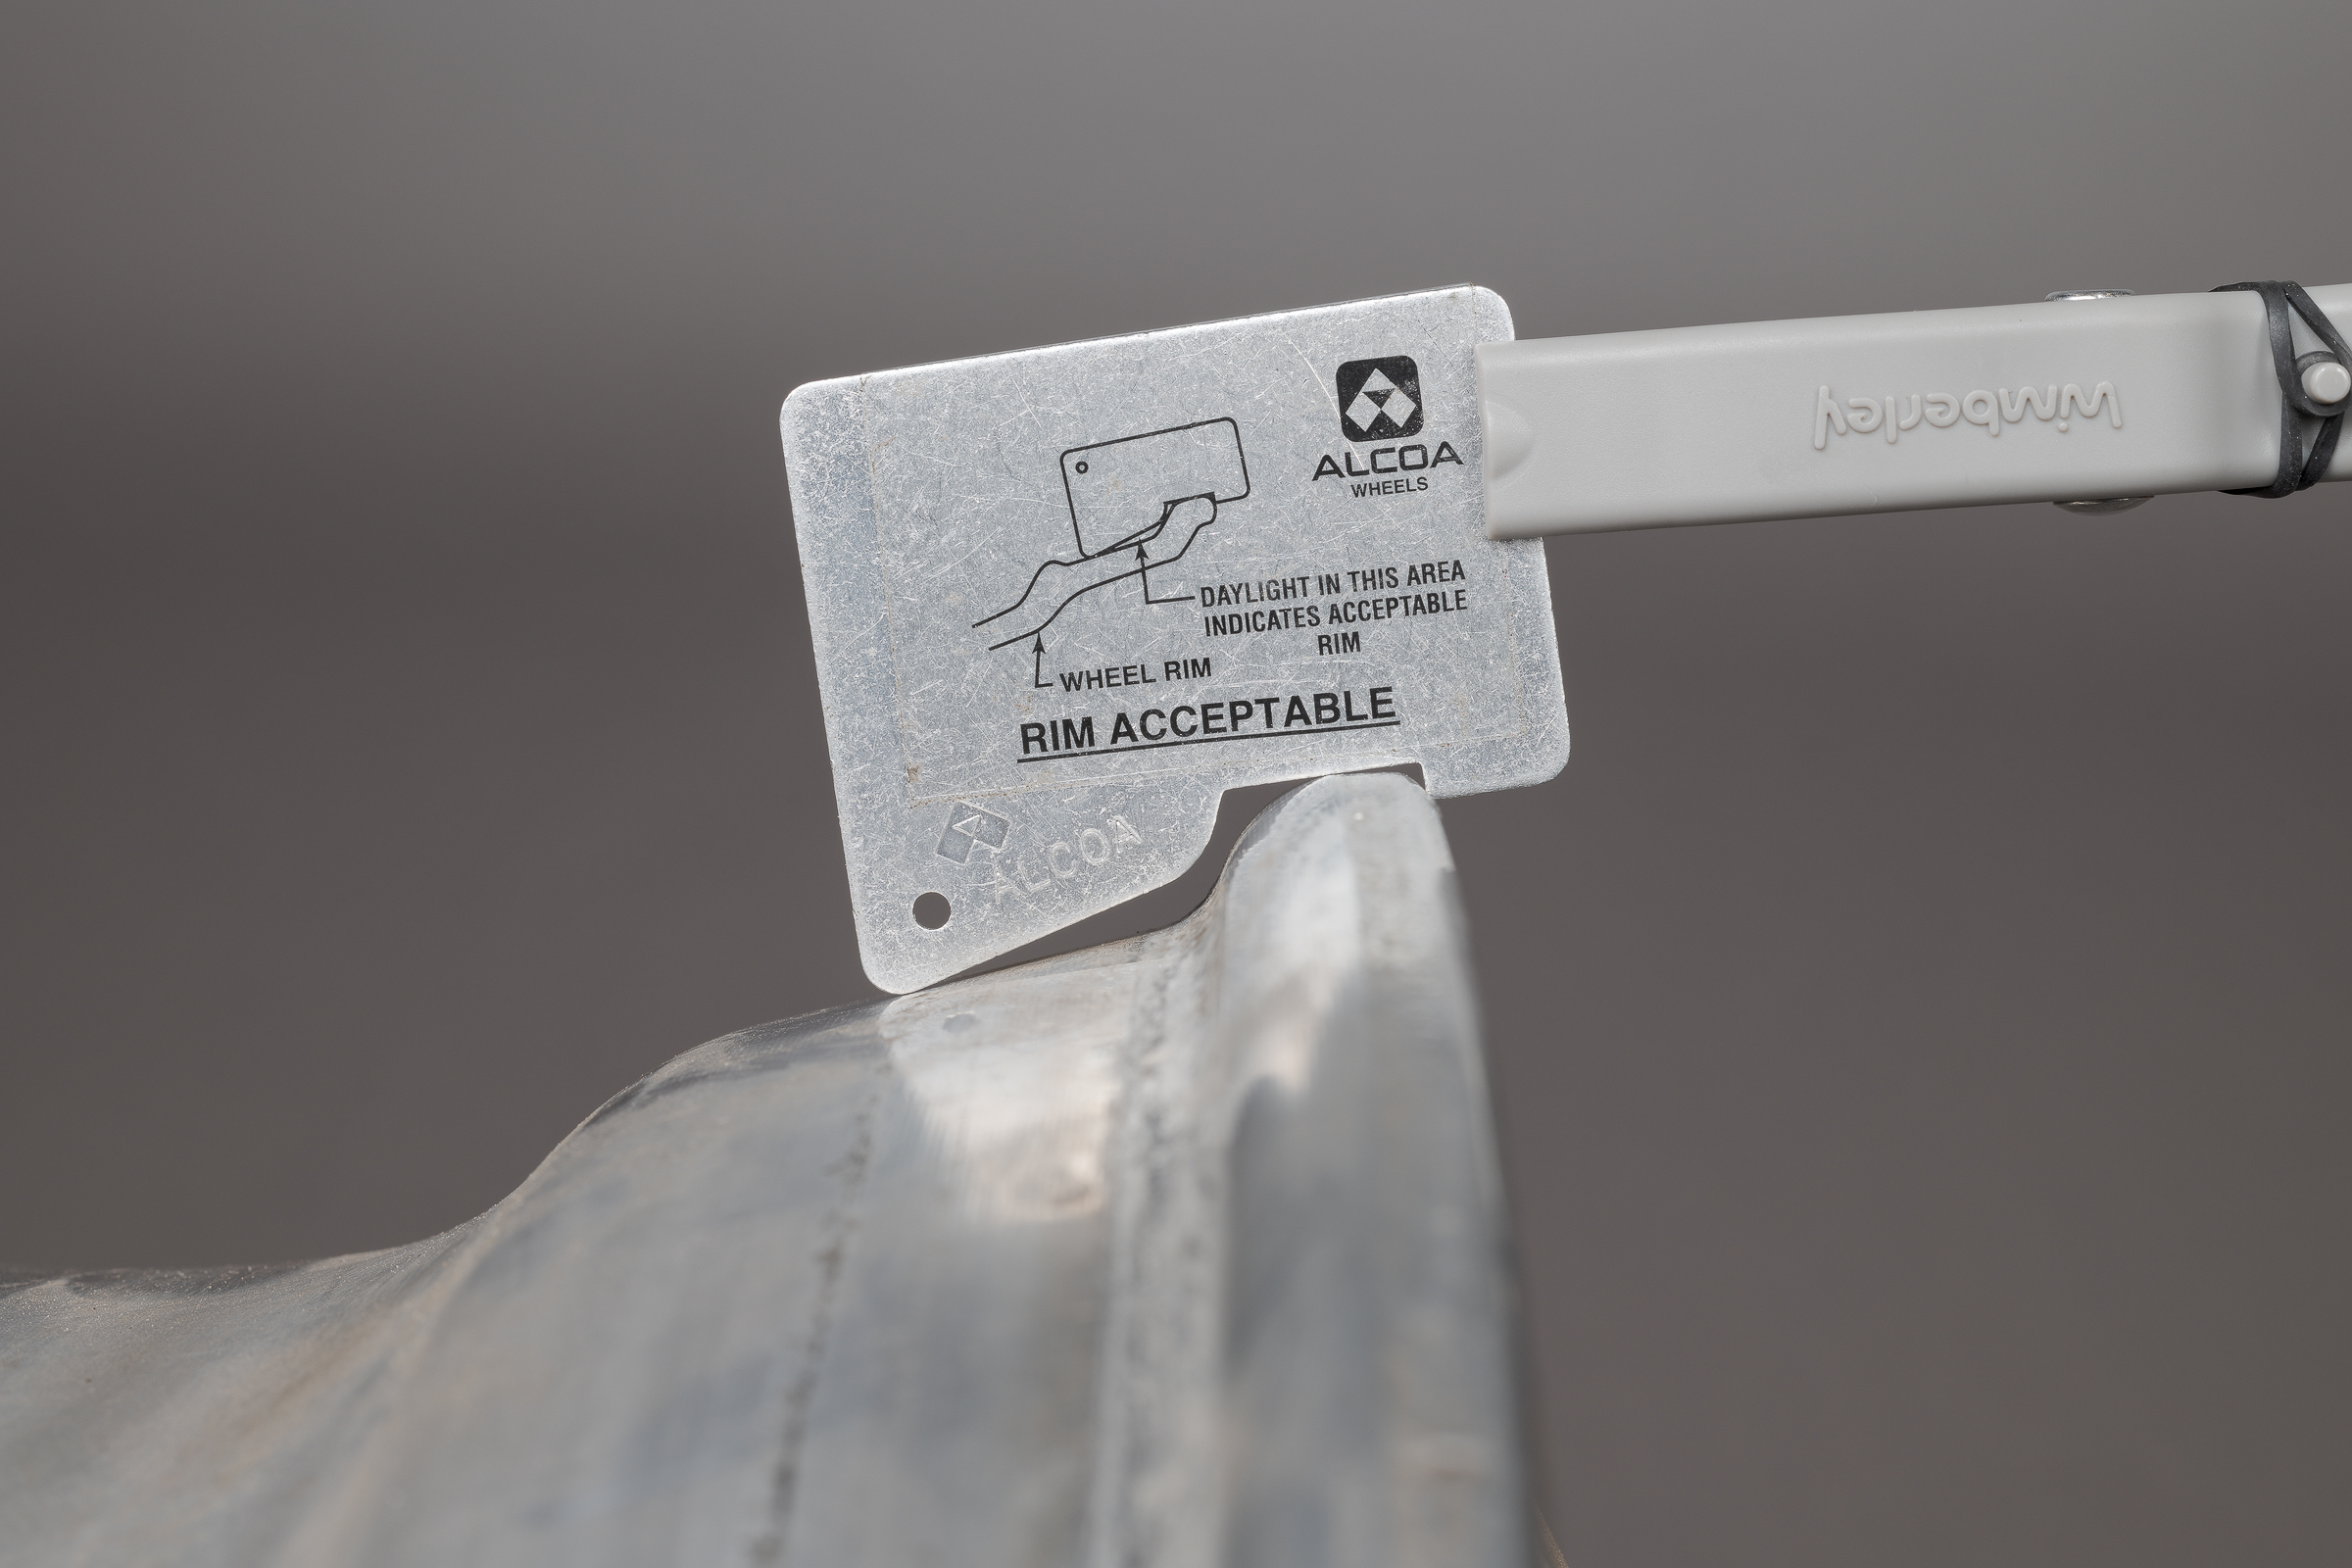
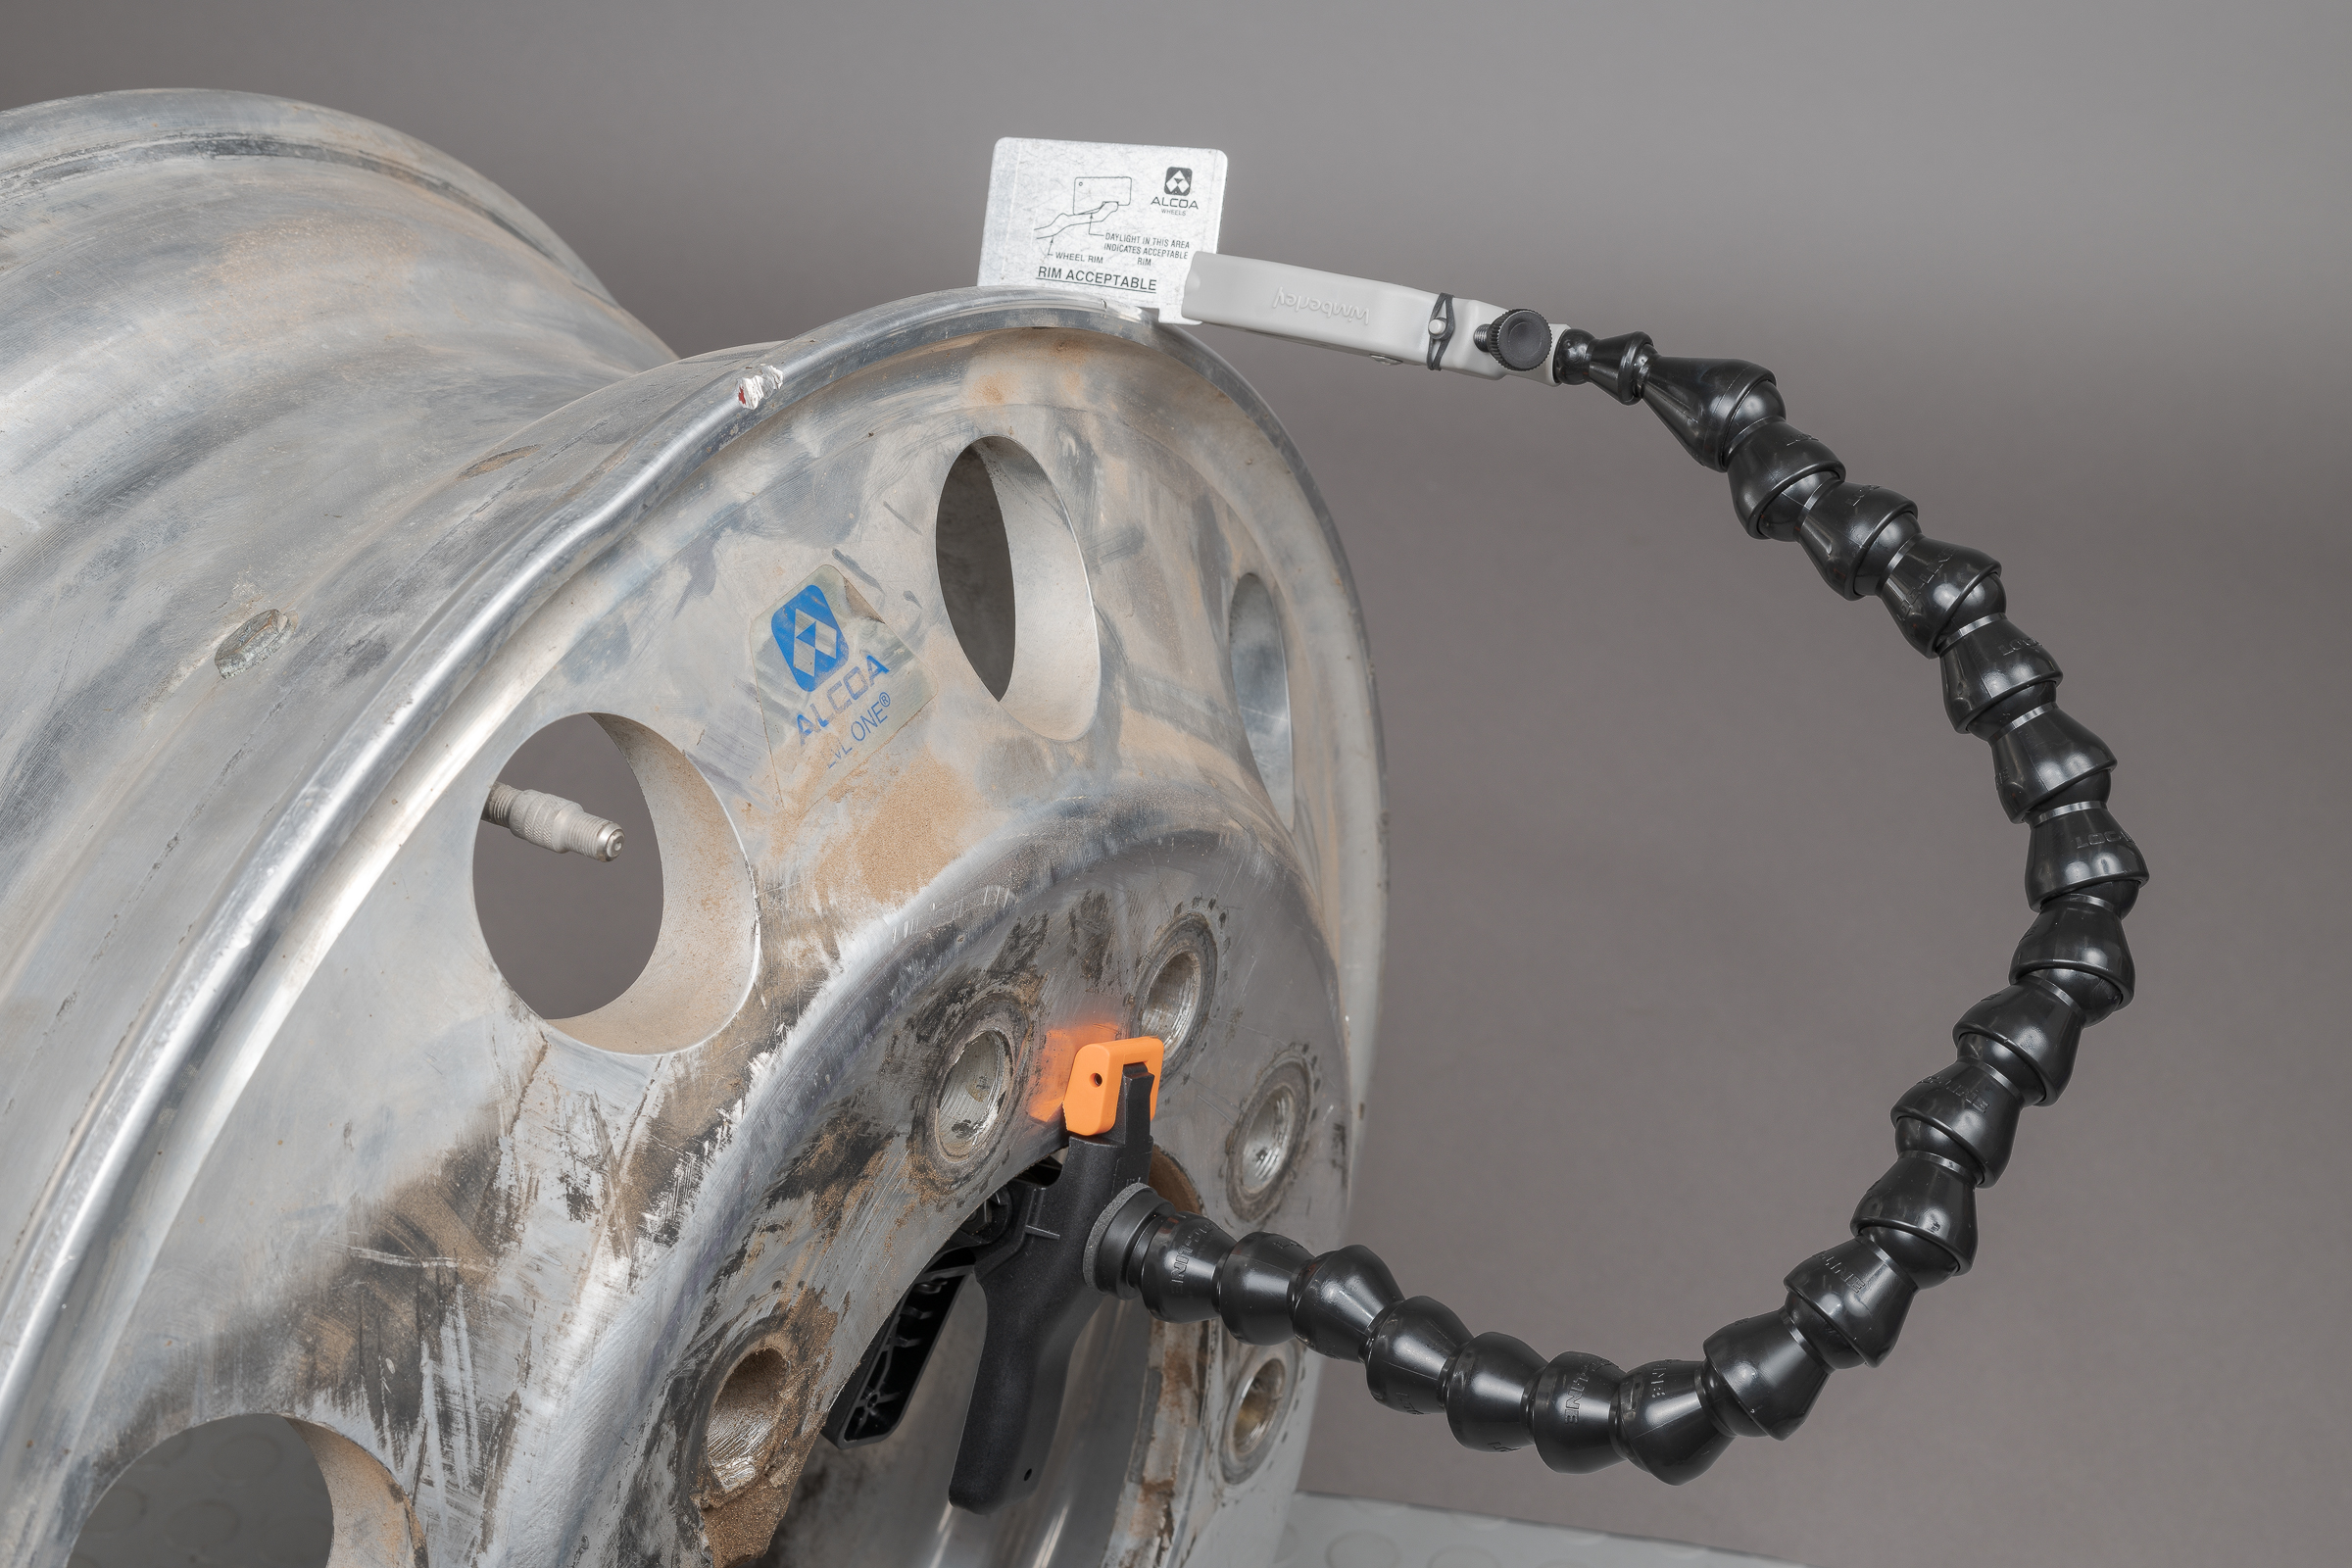
About half the truck wheels sold today are aluminum rather than steel. As with anything, there are trade-offs when comparing steel and aluminum wheels. Aluminum wheels weigh less but cost more than steel wheels. Aluminum wheels don’t rust, of course, but they can suffer from flange wear. Alcoa recommends checking for excessive flange wear using a simple go-no go gauge (Part No. 000700).Alcoa Rim Wear Gauge Go-No Go. (From 2015 Alcoa Wheel Service Manual.)Here’s a photograph of the gauge in use. (Click on image to enlarge, then click on back arrow to return.)Alcoa Rim Wear Gauge on rim flange. (Made with ZEISS Milvus 50 mm macro lens on Nikon D850 with flashes.)While the gauge is quite easy to use, it is more challenging to photograph. It can be tricky to hold the thin aluminum gauge in the proper position while also making a photograph. To make the photograph above, I used a Wimberley The Plamp II with one end clamped on the wheel center hole, and the other end clamped to the gauge.Using Wimberley The Plamp II to hold Alcoa Rim Wear Gauge in place for photography, with flash. (Made with ZEISS Milvus 50 mm macro lens on Nikon D850 with flashes.)The Plamp II is fantastic since it is flexible enough to get into any position, yet stiff enough to remain in place once released. Here’s a link on B&H: Wimberley The Plamp II from B&H. The Plamp II allowed me to quickly and steadily hold the Alcoa gauge perpendicular to the rim and properly up against the flange. It was easy to focus and shoot without any motion from trying to hold the gauge by hand. It also allowed me to get the flashes into position with no shadows from my arm across the photo.
If you need to photograph something like a gauge or ruler, it is worth taking the few minutes to secure it and light it properly. You can often just tape it in place, but that wouldn’t have worked to position this flange wear gauge.
In March 2016, friends and colleagues Wes Grimes (http://cea-az.com/), Greg Wilcoxson (http://www.wilcoxsonconsulting-llc.com/), and I conducted a series of heavy truck acceleration tests using tractors with automated manual transmissions (AMTs) in full auto mode. In auto mode, the transmission chose all shift points without input from the driver.
These were straight-line acceleration tests from a stop using two different truck tractors and two different test drivers. For each truck and driver combination, we ran tests with empty, partially loaded, and fully loaded van semitrailers. The drivers were asked to do half of the runs at what they felt was a “normal” acceleration. The other half of the test runs were at full throttle acceleration. There was a slight slope along the 300-foot test distance, so runs were made in both upslope and downslope directions. Our tests showed the slope, load, and throttle position all influenced when the transmission chose to shift. (Click on image to enlarge, then click on back arrow to return.)Panning during Kenworth Acceleration Test (ZEISS 50 mm f/2 macro lens on Nikon D810.)Technical papers describing the results of both test series have now completed the peer review process and have been published by SAE. We presented these papers at SAE’s World Congress Experience WCX 17 in Detroit on Wednesday, April 5, 2017. SAE has these paper available through these links:
Special thanks to Contract Freighters, Inc. (CFI) and XPO Logistics for the generous use of their tractors, trailers, loads, scales, facilities, and test drivers at their facility in Joplin, MO.